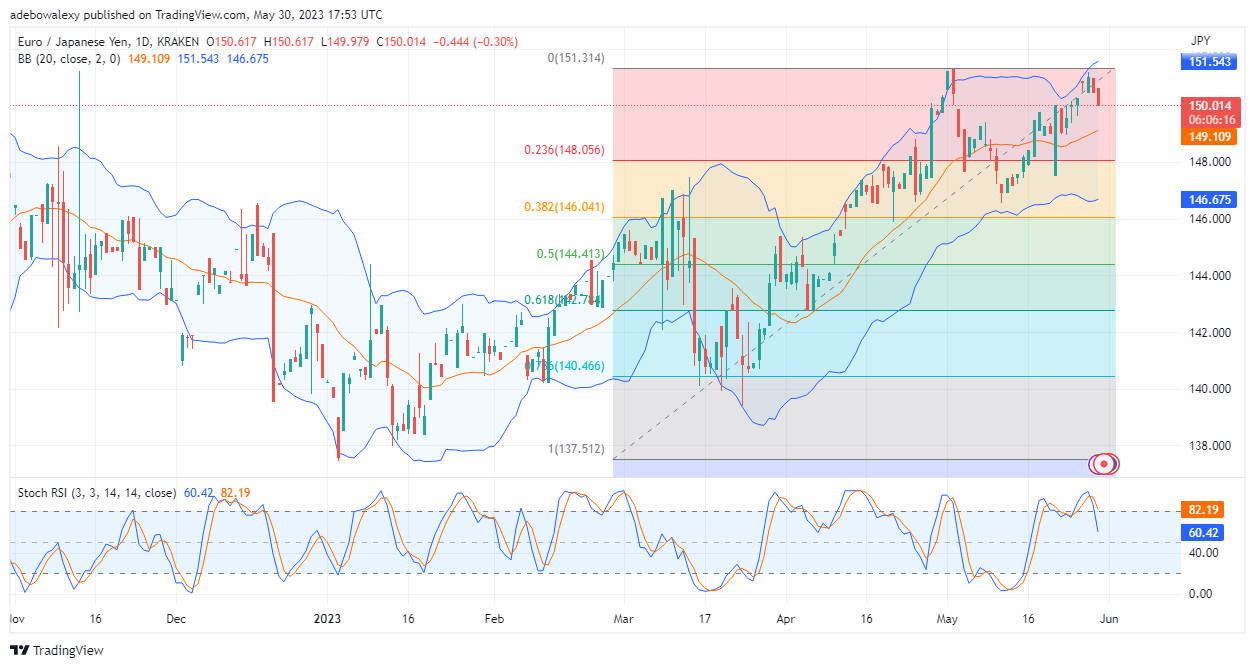
EURJPY’s price action has sustained its activities in the headwind region for a significant length of time. And, over the past two trading sessions, price action retraced near a previous peak level of 151.00 mark. However, just like before, this moves triggered downward forces, and price action has now picked a downward path at this point.
Major Price Levels:
Resistance Levels: 150.50, 151.00, and 152.00
sSupport Levels: 150.00, 149.50, and 149.00

EURJPY Heads Toward Support Levels
After price action on the EURJPY daily market revisits near the 151.00 price mark, it appears that this may have hit a significant amount of take profit. Consequently, this resulted in a downward retracement of the price in this market. The Relative Strength Index (RSI) indicator has displayed a bearish crossover, which indicates a reduction in bullish momentum. As such, this suggests that price action has taken a downward path. Also, considering the size of the last price candlestick here, it looks like price action has significant volatility, and the downward retracement may be rapid.

The Resistance Mounted by Buyers in the EURJPY Market Looks Weak
Moving to the 4-hour market, one can see that the downward retracement in the EURJPY market is facing some resistance. This can be seen as dashed-shaped price candles have been appearing since the previous trading session. Nevertheless, this resistance looks weak, as the mentioned price candlesticks are below the middle band of the Bollinger Bands indicator. Also, the Moving Average Convergence Divergence (MACD) indicator curves are now trending downward, with its histogram bars appearing solid red. The RSI lines can be seen in the oversold region, and it appears that their lines may fall lower into the oversold zone as a bearish crossover can be observed on them. Consequently, traders can expect a retracement of the 148.50 price level.
Do you want to take your trading to the next level? Join the best platform for that here.


Leave a Reply