The EURJPY market appears static from a fundamental perspective, leaving price activity influenced primarily by supply and demand forces. However, the Japanese yen seems to be attracting attention, creating a headwind in the market.
Key Price Levels:
Resistance Levels: 165.00, 170.00, 175.00
Support Levels: 160.00, 150.00, 145.00

EURJPY Resumes Trading Below the Bollinger Band’s Moving Average (MA)
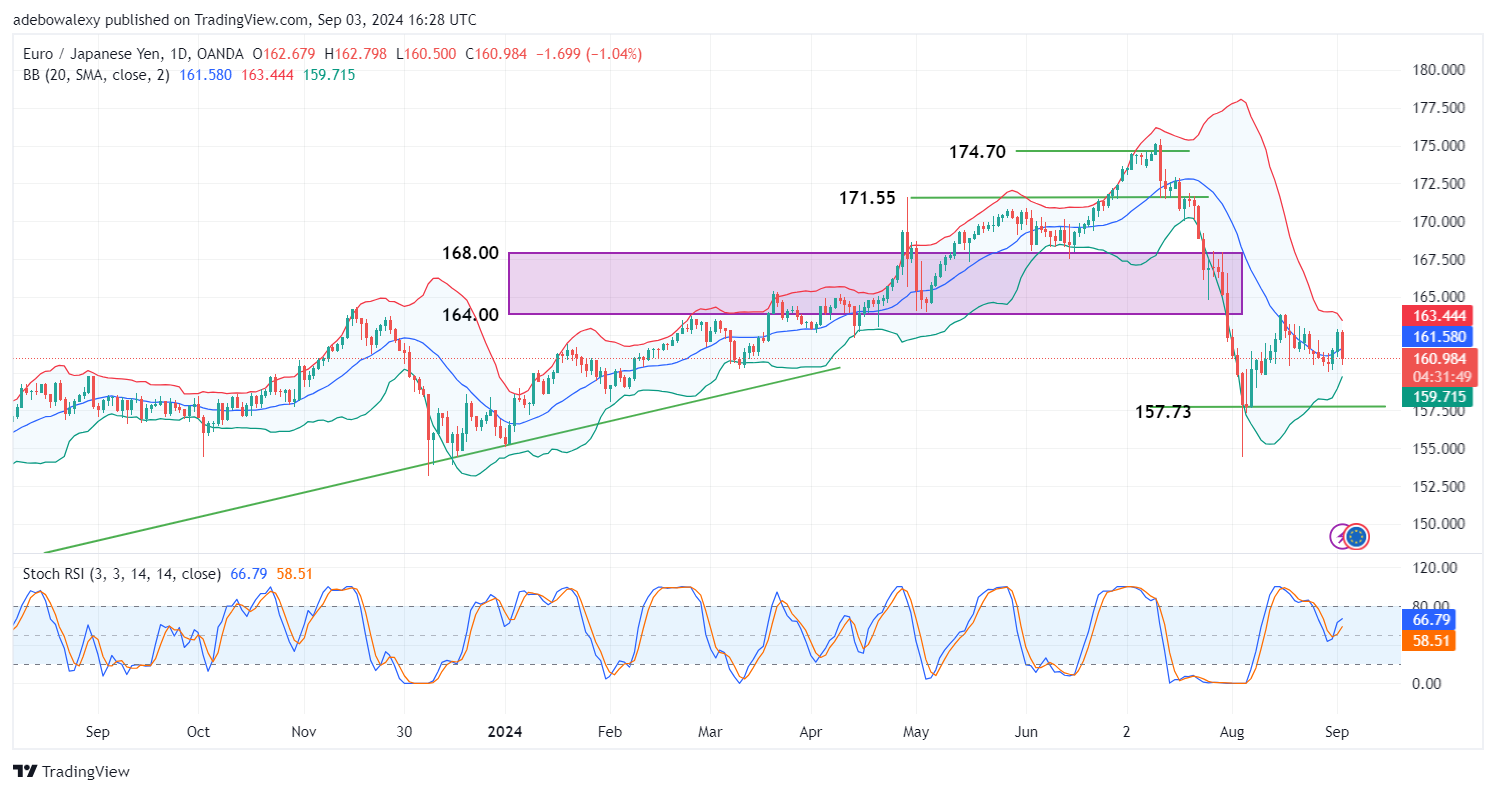
The previous session in the EURJPY market saw price action settle just above the middle line of the Bollinger Bands (BB) indicator. However, the headwinds created by the JPY grew stronger, causing the price to fall sharply below the middle line of the BB indicator.
This decline wiped out nearly all the gains from the past two sessions. Despite this, the Stochastic Relative Strength Index (Stochastic RSI) lines show a deflection while maintaining an overall upward trajectory. This suggests that the 162.00 price level may be under pressure from downward forces, given the market’s recent rebound-off resistance.
EURJPY Seems More Likely to Hit the 160.00 Threshold Soon
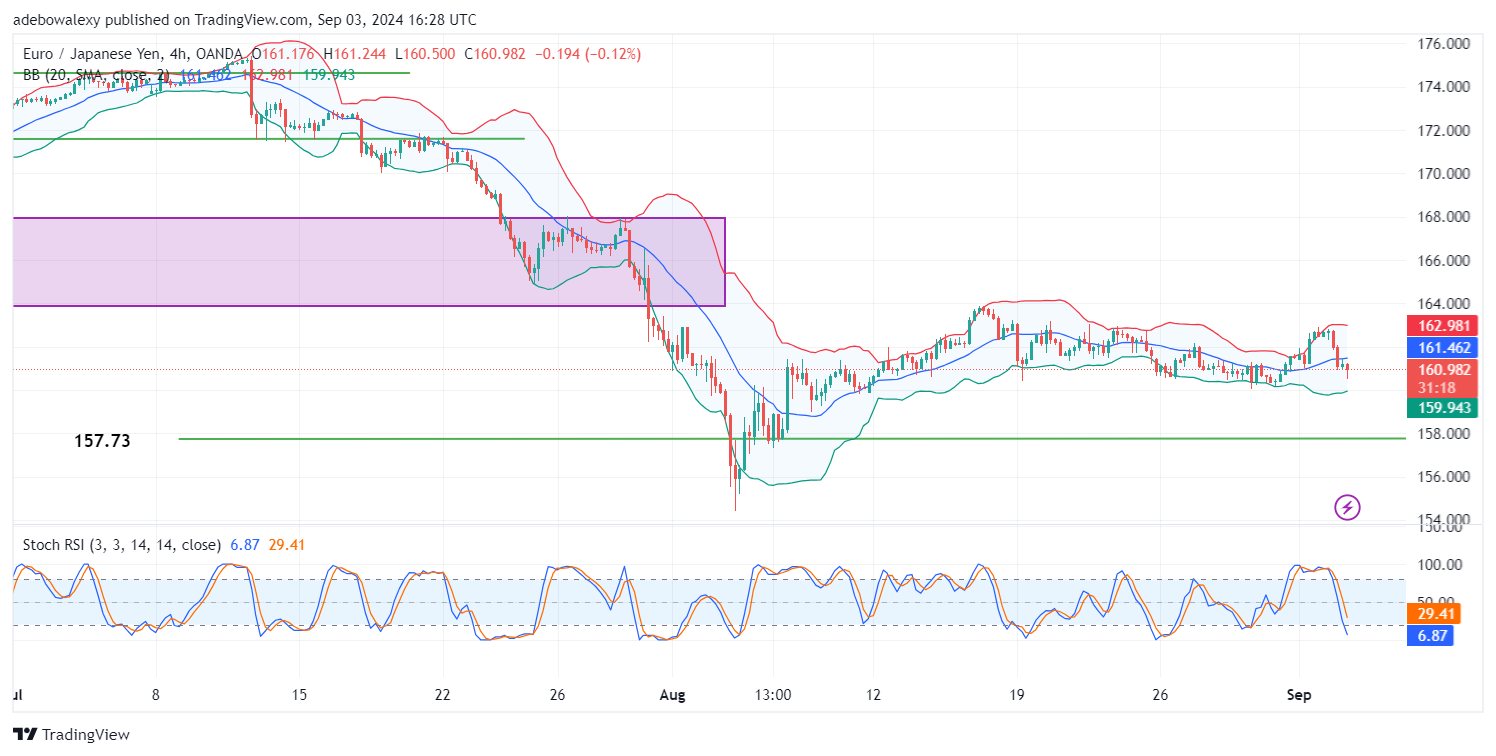
On the 4-hour chart, the EURJPY market shows that price action may be heading towards a technical support level. The last price candle is clearly below the middle line of the BB indicator, indicating a potential further decline.
Simultaneously, the Stochastic RSI indicator is trending downward toward the oversold region. However, the last price candle has a longer lower shadow, indicating that upward forces are still active but facing strong opposition. Therefore, it seems prudent to maintain a bearish outlook, at least toward the 160.00 mark.
Do you want to take your trading to the next level? Join the best platform for that here.


Leave a Reply