The price action in the EUR/JPY market seems to have regained its bullish characteristics. This opinion is based on the indications that are coming from the technical indicators on its daily chart. Will the price continue to bounce higher? Let’s study the market to find out.
Major Price Levels:
Top Levels: 145.41, 146.00, and 145.40
Floor Levels: 145.11, 144.70, and 144.40

EURJPY Shows More Bullish Features
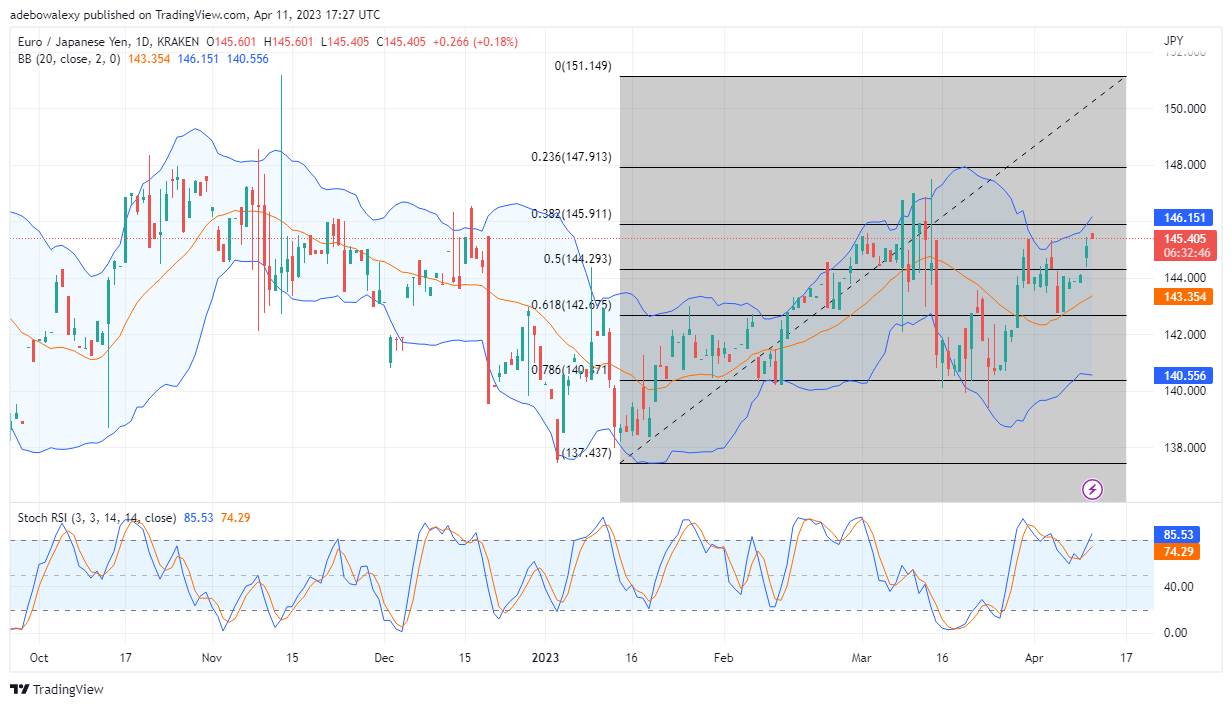
During the previous session in the EURJPY daily market, price action spontaneously busted through the Fibonacci Retracement level 50. However, the price candle for the current session has arrived bearish, causing the price to retrace a bit downward. Nevertheless, the appearance of the Bollinger Bands indicator suggests that more upside moves may occur in this market. The last price candle stays a considerable distance above the middle band of the Bollinger Bands indicator, while the indicator itself has taken an upside bearing. Meanwhile, the Stochastic Relative Strength Index (SRSI) indicator curve has performed a bullish crossover and is trending upward. Consequently, this points out that price action has an upside bearing.

EURJPY Stays Extra Choppy but Has an Upside Aim
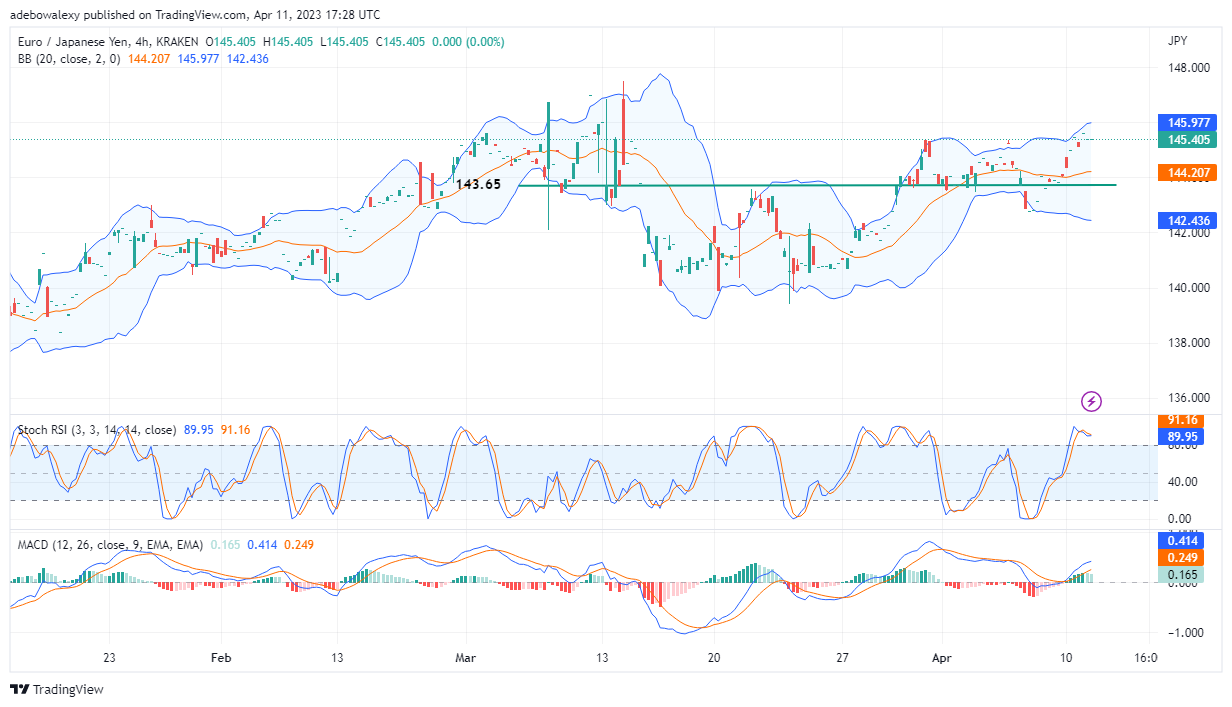
On the 4-hour market, price action looks very erratic, as dashed-shaped price candles seem scattered all over the chart. Meanwhile, the last dashed-shaped price candle on this chart stays green and is positioned very high above the MA line of the Bollinger Bands. At the same time, the RSI curves are about to give a bullish crossover while in the overbought region. Also, the lines of the Moving Average Convergence Divergence indicator curves are still rising upward about the equilibrium level at 0.25 and 0.16. Although the appearance of the bars in this indicator suggests that buyers are weak. Nevertheless, going by the majority of signs emanating from trading indicators on this chart, price action may keep moving toward the 146.50 mark.
Do you want to take your trading to the next level? Join the best platform for that here.


Leave a Reply