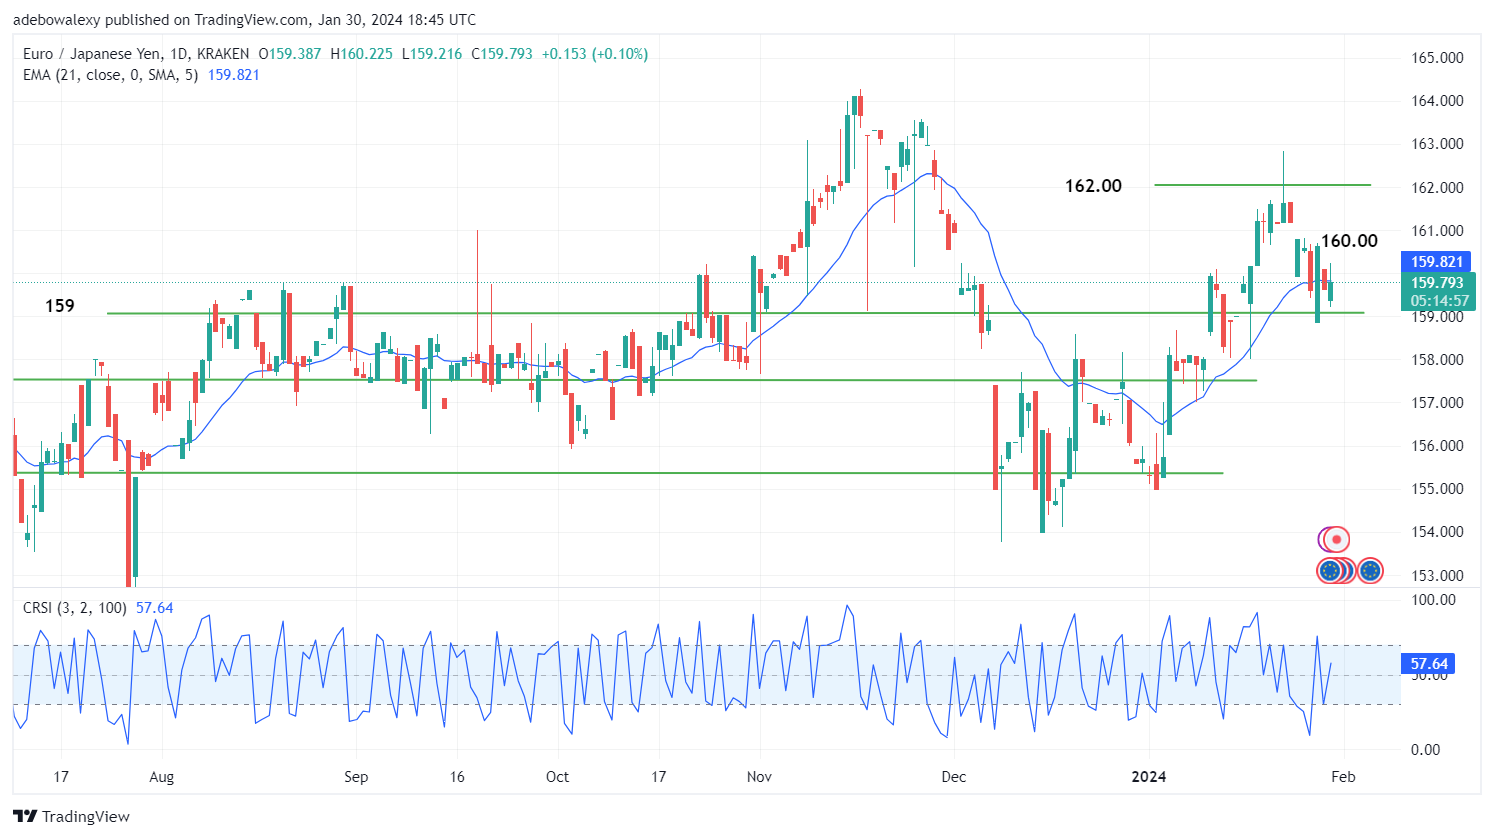
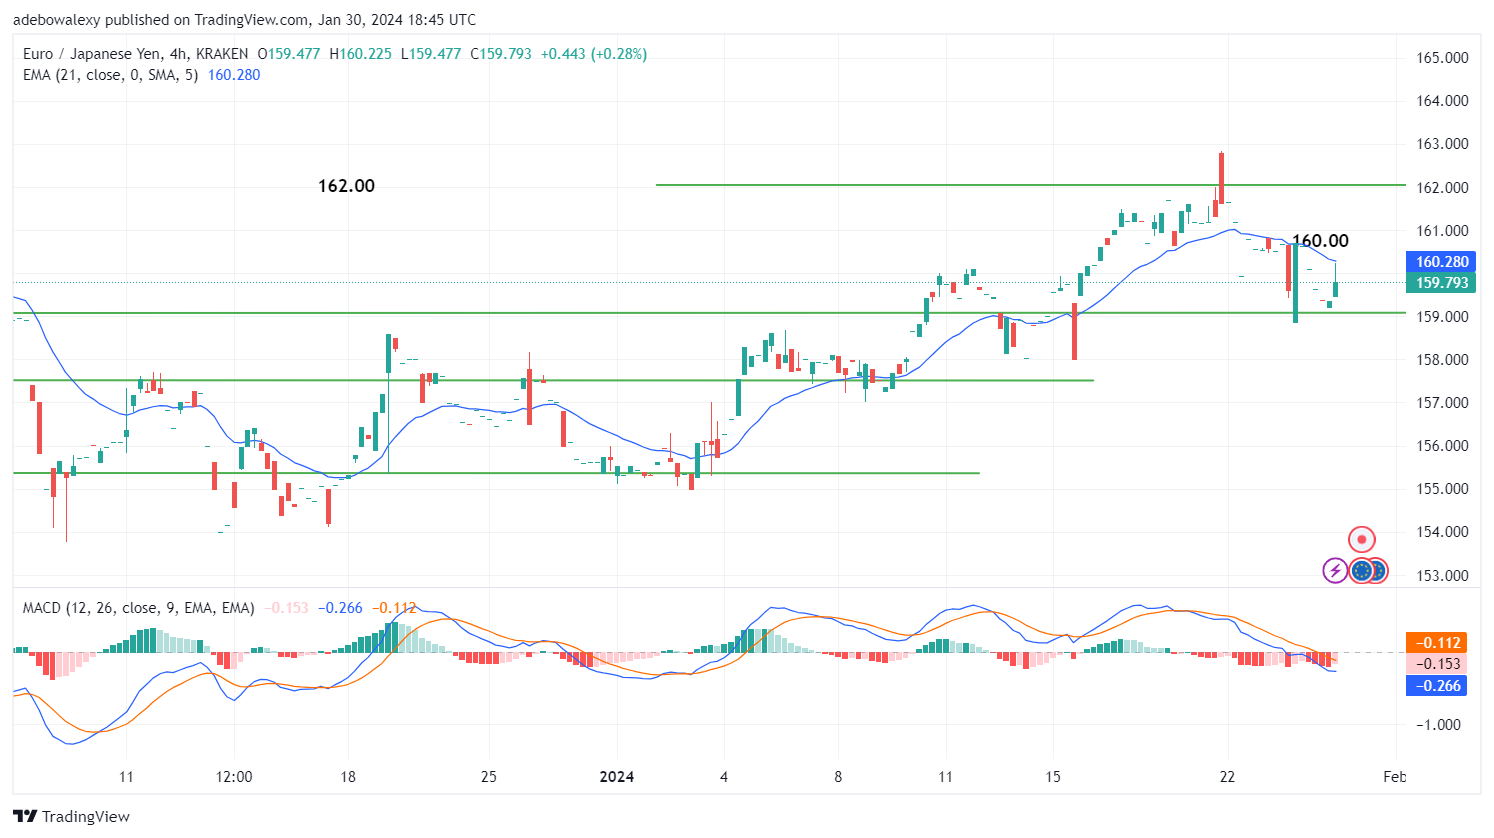
It is clear that EURJPY is choppy but has seemed to rebound in a positive direction upon the arrival of the Eurozone’s GDP data. The ongoing session has seen moderate gains, bringing some recovery to traders in the market.
Key Price Levels:
Resistance Levels: 159.79, 160.00, and 161.00
Support Levels: 159.00, 158.00, and 157.00

EURJPY Price Action Stays Around the Moving Average Indicator Line
The Eurozone GDP seems to have refocused the EURJPY market toward the 160 mark, which is a nearby target. However, it appears that the pair had earlier been traded above the focused resistance, but headwinds seem to have caused some contractions in the market.
While the Connor Relative Strength Index (CRSI) line still points to the fact that upside momentum may cause prices to rise back upwards, the CRSI indicator line keeps pointing sharply upwards above the 50 level of the indicator. Additionally, the appearance of the last price candle in this chart still holds some indications suggesting that upside forces are still in favor of possible additional price increases in this market.

EURJPY Desperately Holding on to Price Target Around the 160.50 Mark
Price activity in EURJPY stays consistent with its upside rebound after its price action corrected off support near the 159 support level. Despite the rejection in the ongoing session, it appears that this session, as of the time of writing, is more profitable than the previous one. Meanwhile, the upper shadow of the ongoing session is touching the 21-day MA line, showing that there has been a notable price contraction in this market.
The Moving Average Convergence Divergence (MACD) indicator bar shows that bears are still losing in this market. Although the indicator lines are now below the equilibrium level, traders may still want to stick to forex signals with targets around the 160.50 mark.
Do you want to take your trading to the next level? Join the best platform for that here.


Leave a Reply