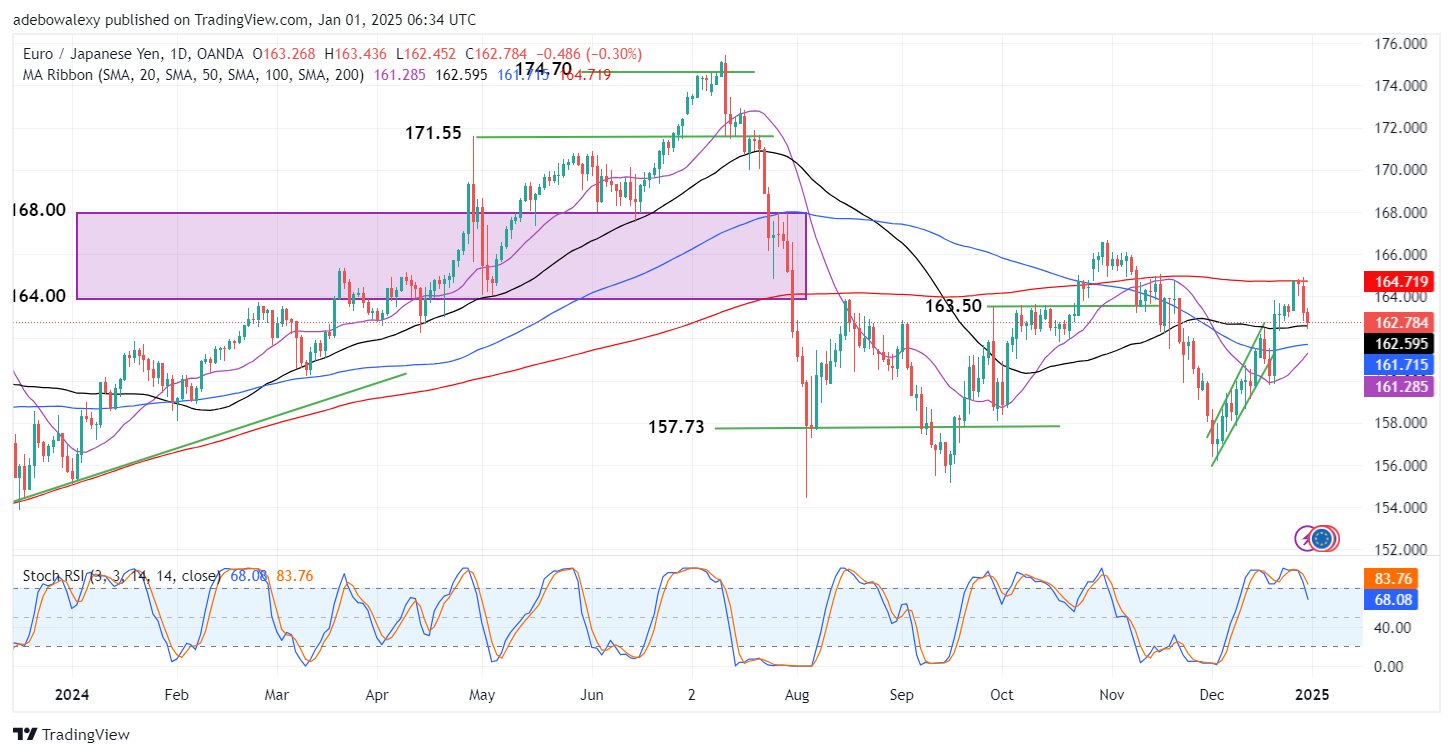
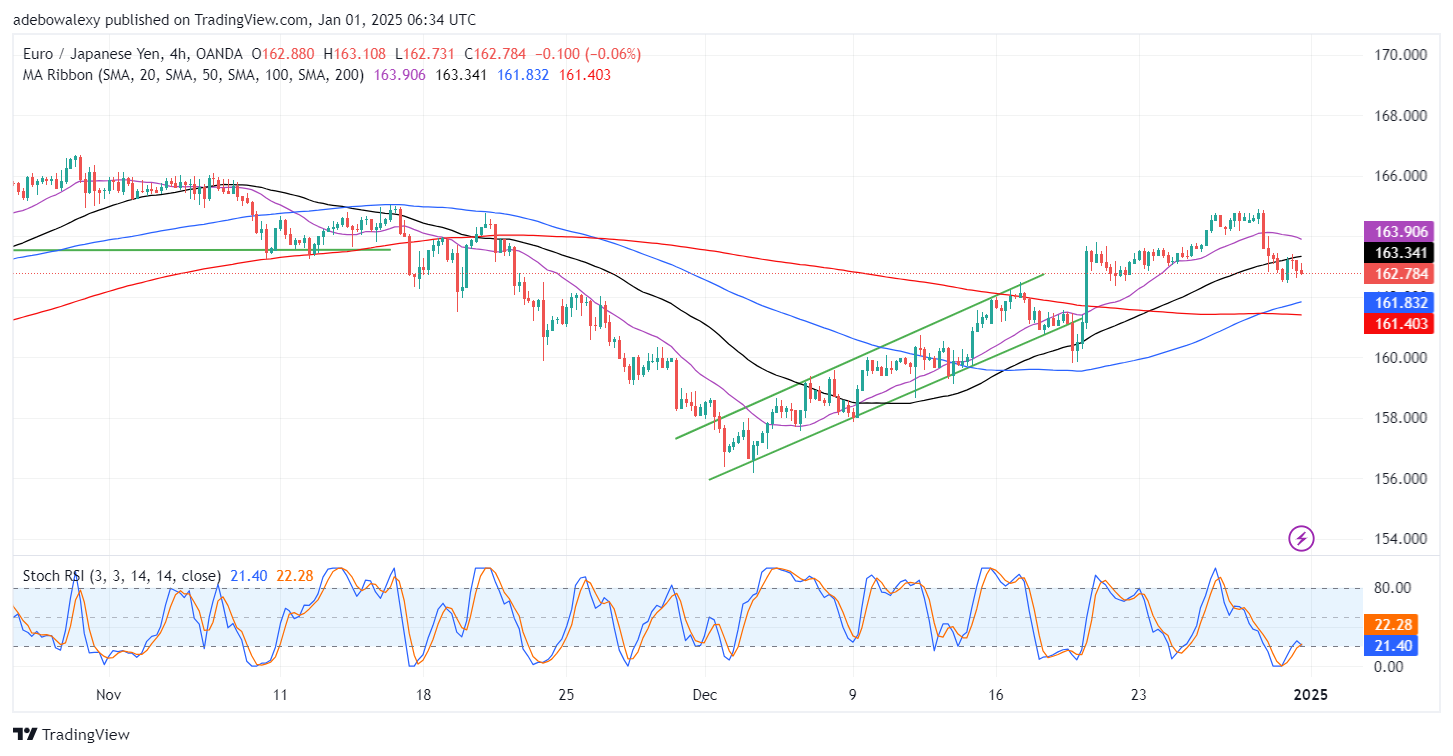
The EURJPY market has been experiencing an upward correction in recent times. However, the market recently encountered a brick wall around the 164.75 price level. Nevertheless, price action continues to retrace lower levels even as the economic calendar seems quiet on account of the New Year holiday.
Key Price Levels:
Resistance Levels: 164.00, 166.00, 168.00
Support Levels: 162.00, 161.00, 160.00

Will EURJPY Find Support at the 50-Day MA Line?
After EURJPY price activity tested the resistance formed by the 200-day Moving Average (MA) lines, the market retraced downward strongly in the previous session. The ongoing session has maintained the price trajectory and now stands just above the 50-day MA curve. Also, the Stochastic Relative Strength Index (RSI) lines are falling downward and towards the 80 level of the indicator.
Meanwhile, the 20- and 100-day MA lines seem to be tending towards a crossover below price action. This therefore suggests that the support at the 50-day may hold should a crossover result between the 20- and 100-day MA lines. However, this seems largely dependent on price forces.

EURJPY Seems Prone to Further Price Declines
On the EURJPY 4-hour market, we can see that price action is now below the 20 and 50-day MA lines. Likewise, price action stays bearish as displayed via the corresponding price candle. The 100- and 200-day MA lines had previously delivered an upside crossover below the price action, and this propelled the market in the past three sessions.
However, the 50-day MA line has presented an effective resistance to price action, causing the market to turn south. At the same time, the Stochastic RSI lines can be seen converged for a bearish crossover at the 20 threshold of the indicator. Therefore, traders can take targets at the support of 162.00.
Do you want to take your trading to the next level? Join the best platform for that here.


Leave a Reply