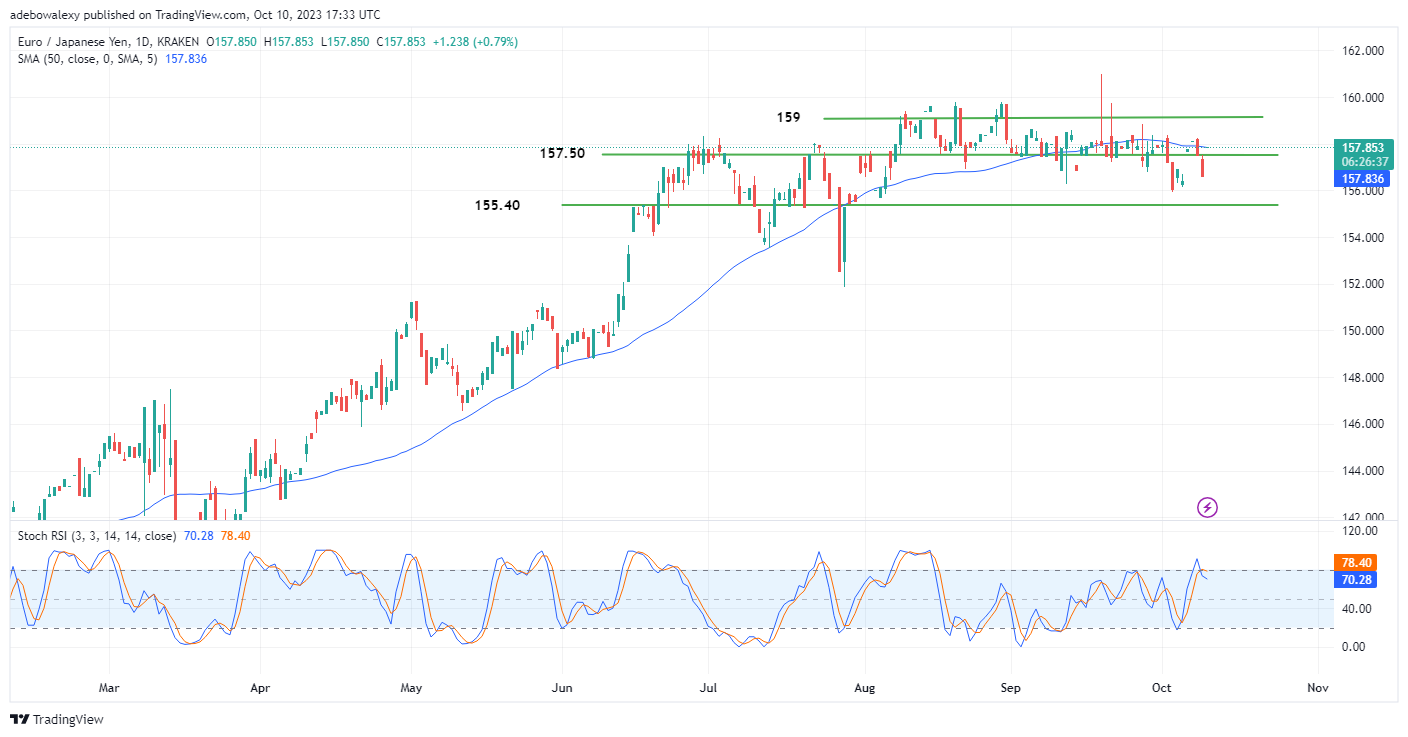
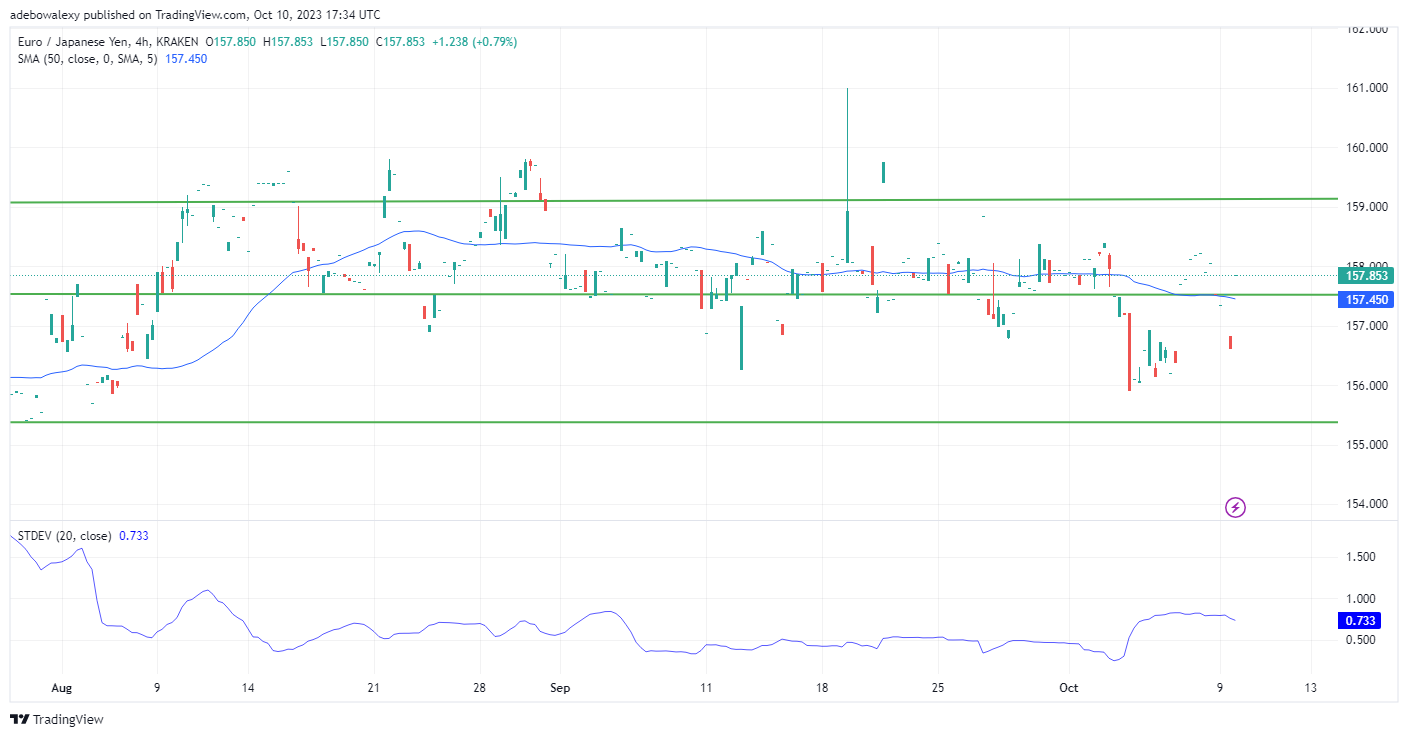
The EURJPY continues to hold on to its choppy characteristics as price action in this market continues to behave in an unstable manner between the 155.00 and 159.00 price levels. As a result, the pair hasn’t been able to surpass the 159.00 threshold for a while, much of which is due to the boring euro side of the market.
Major Price Levels:
Resistance Levels: 157.85, 158.50, and 159.50
Support Levels: 157.00, 156.00, and 155.00

EURJPY Bulls Won despite the Lack of Significant Activity in the Ongoing Session
Price action in the EURJPY daily market has aligned with the Moving Average curve on this price chart. However, considering the ongoing session, one can see that buyers and sellers seem to lack interest at this point. This inference is drawn from the size of the last price candle on this chart.
Meanwhile, the Relative Strength Index (RSI) indicator lines maintain a bearish outlook following a crossover in the overbought region of the indicator. The line of this indicator can be seen now trending downwards below the 80 mark. By implication, this suggests that price action may have hit a strong resistance at the 157.86 mark.

Indications from the EURJPY Market Seem Divergent
In the EURJPY 4-hour market, it could be seen that price action is above the 50-day MA line. However, price candles continue to appear as a dash in the market, portraying unpredictable characteristics. At the same time, the Standard Deviation curve can be seen pointing towards the lower marks from below the 0.80 mark.
Consequently, the divergent nature of technical indicators in the analysis of this price chart suggests that price activities here are somewhat difficult to predict. However, extrapolating indications from the daily market, it seems very likely that price activities may rebound towards lower price levels, perhaps towards the 157.00 mark shortly.
Do you want to take your trading to the next level? Join the best platform for that here.


Leave a Reply