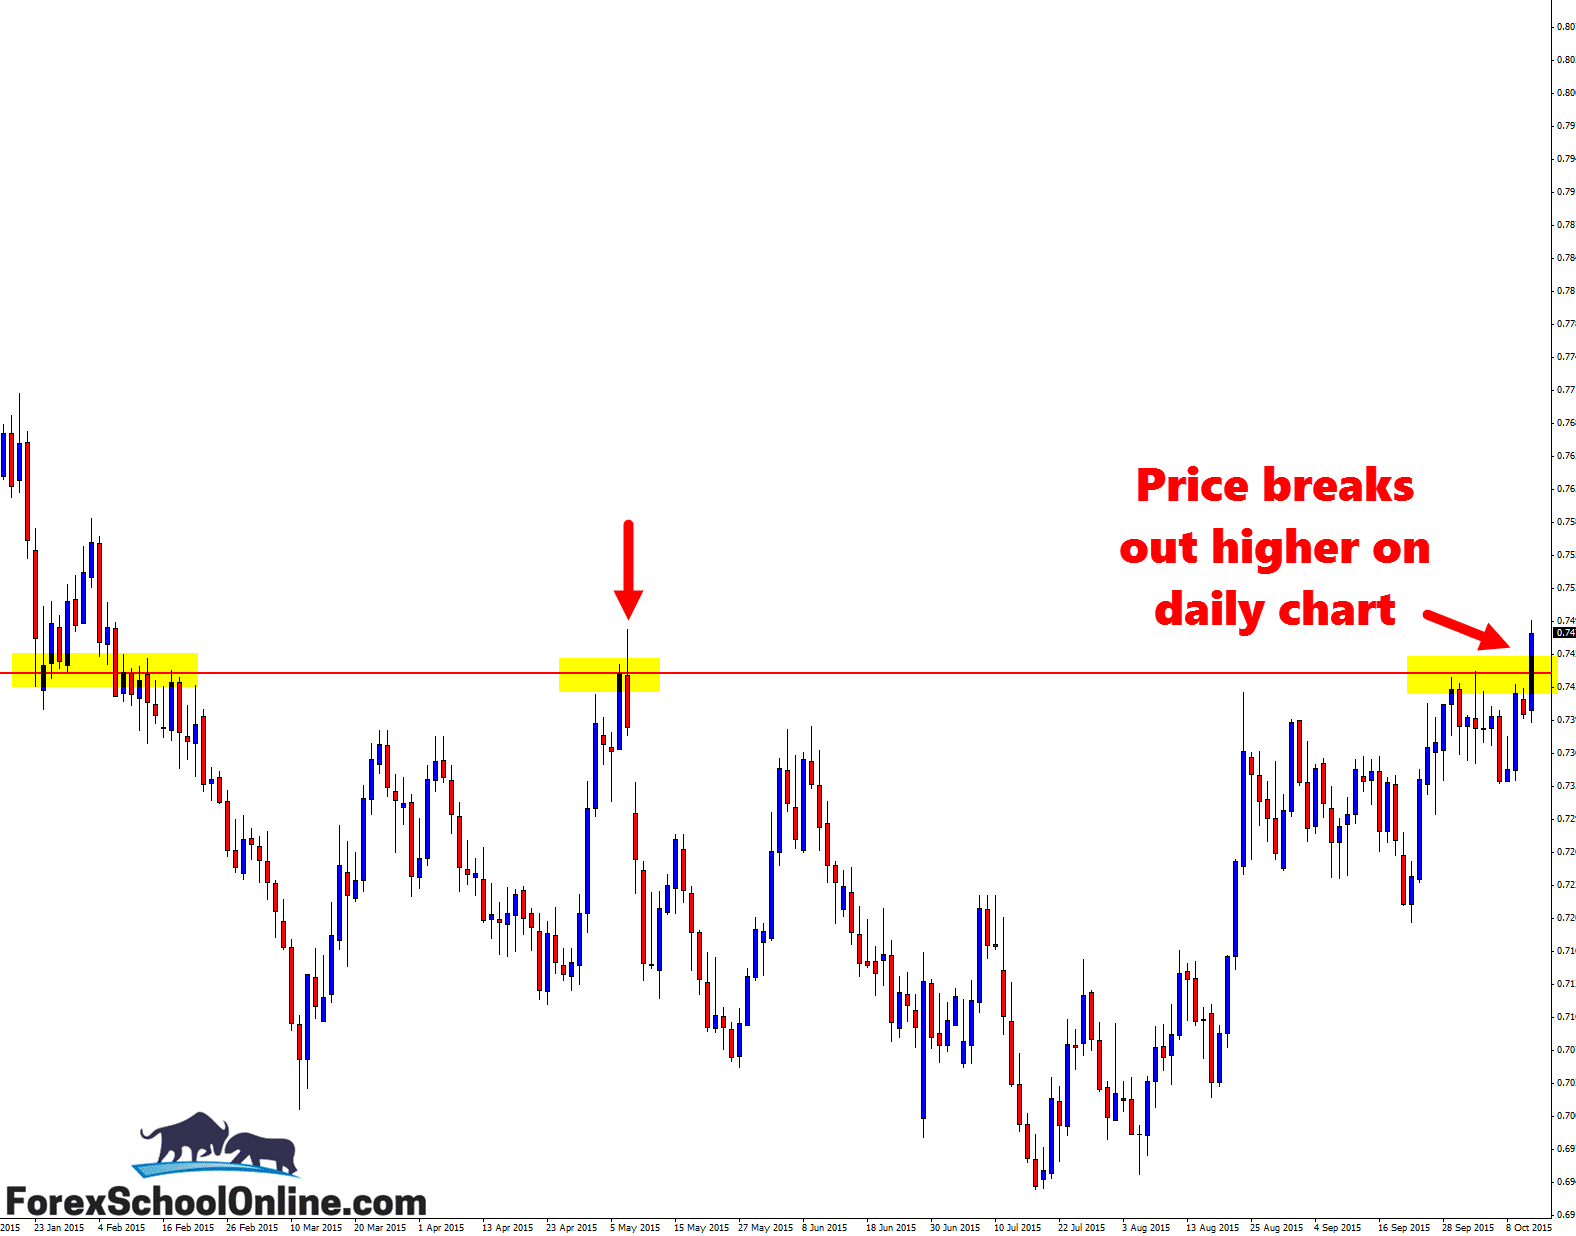
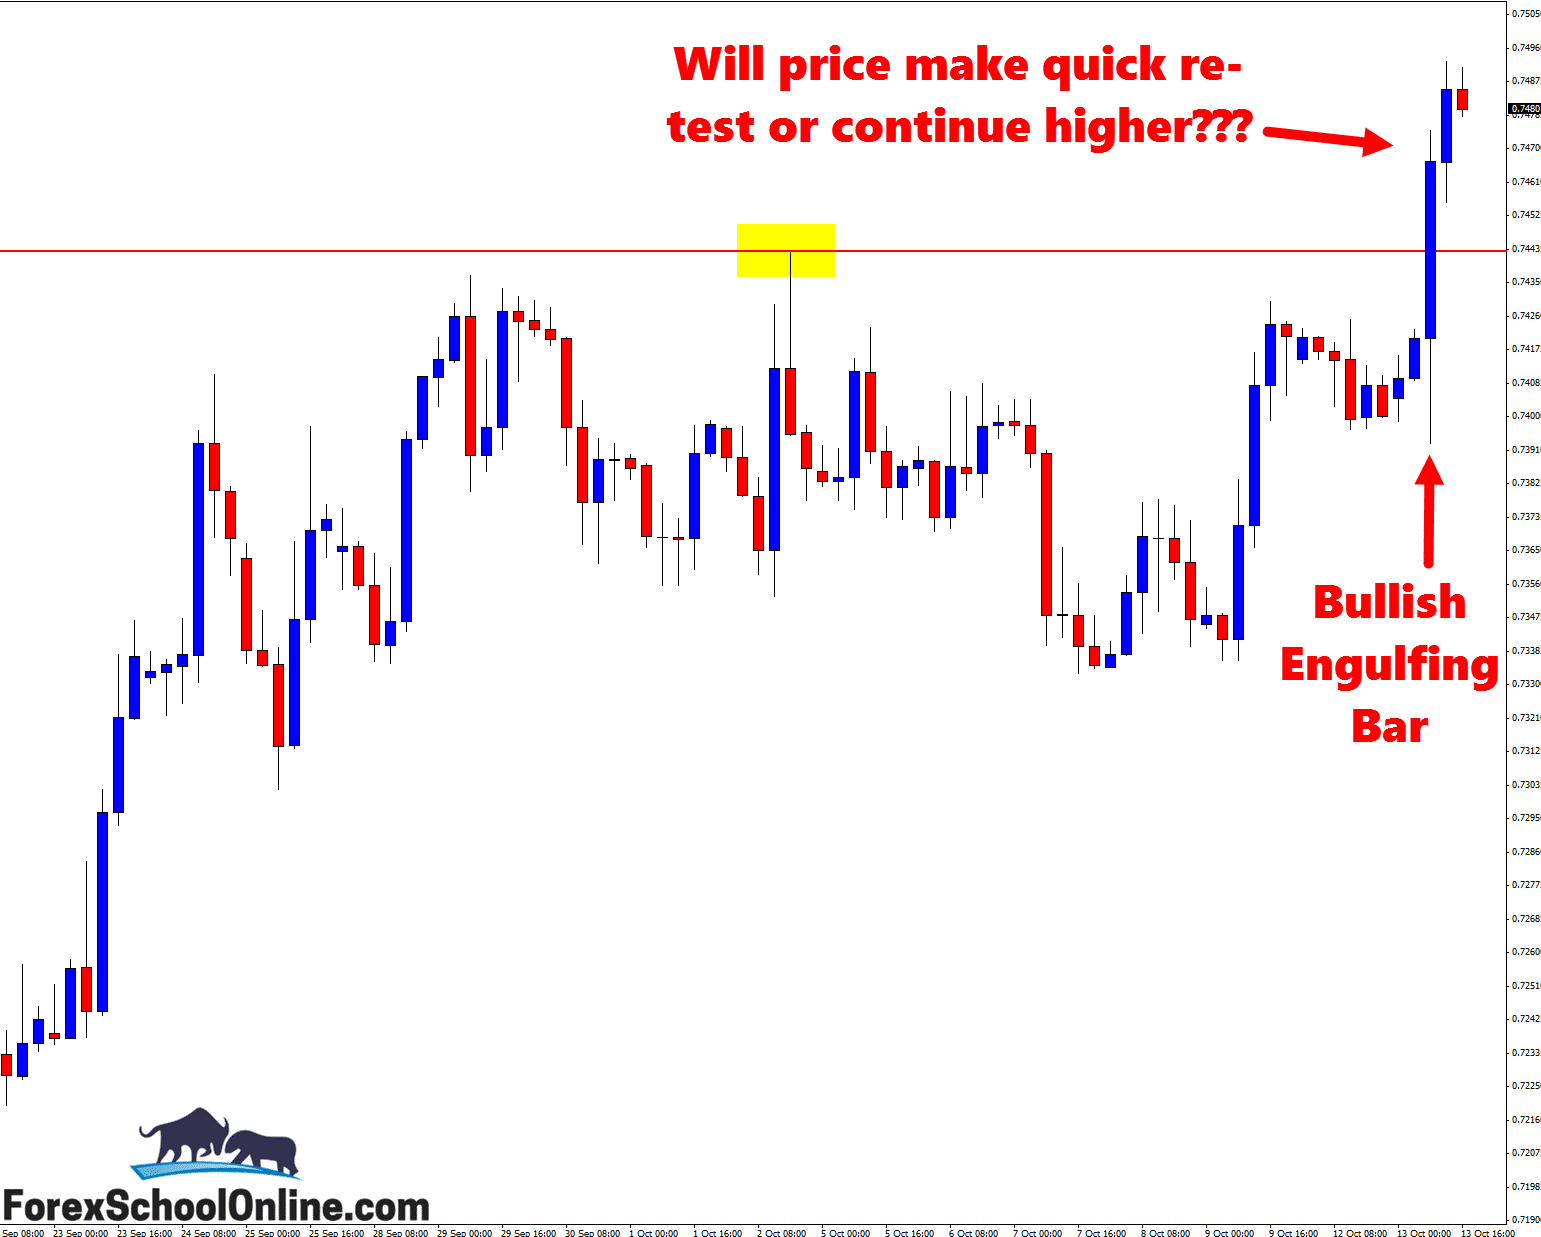
The EURGBP has broken out higher and above a major daily resistance level with a Bullish Engulfing Bar = BUEB on the 4 hour price action chart. The bullish engulfing bar is a huge and obvious candle that is commanding a lot of momentum and, as my 4 hour chart shows below, price close is well up and above the resistance level.
As I often discuss in the daily Forex trade commentary section, as price action traders, we can learn a lot about the overall price action story about where price can, and more importantly, can’t close. I have an in-depth lesson and video on this that shows exactly how you can use both candlesticks and the surrounding price action to read the overall price action story, and you can get it here:
The Secrets Traders Can Read From Candlesticks & Price Action
As the daily chart shows below, price had been trading sideways in this pair for some time without being in a clear trend in either direction. Price had just been slowly creeping higher toward this overhead resistance in stages.
The major daily resistance level that price has now broken through is an important level that price also previously had paused and held at as a support level. Now that price is through and above, it could now once again become a price flip and flip from an old resistance to a new support level.
It is going to be interesting to watch the price action behavior and see what it does from here. Will price make a quick retrace and a re-test of the new support? Or will it continue with the breakout and new momentum? If price does make a re-test, then you could look for potential long trades with the new strong breakout momentum.
Any long trades would need to be confirmed with high probability A+ trigger signals just like the ones I go through in my personal high probability checklist.
Daily Chart – Breakout Higher

4 Hour Chart – Bullish Engulfing Bar


Leave a Reply