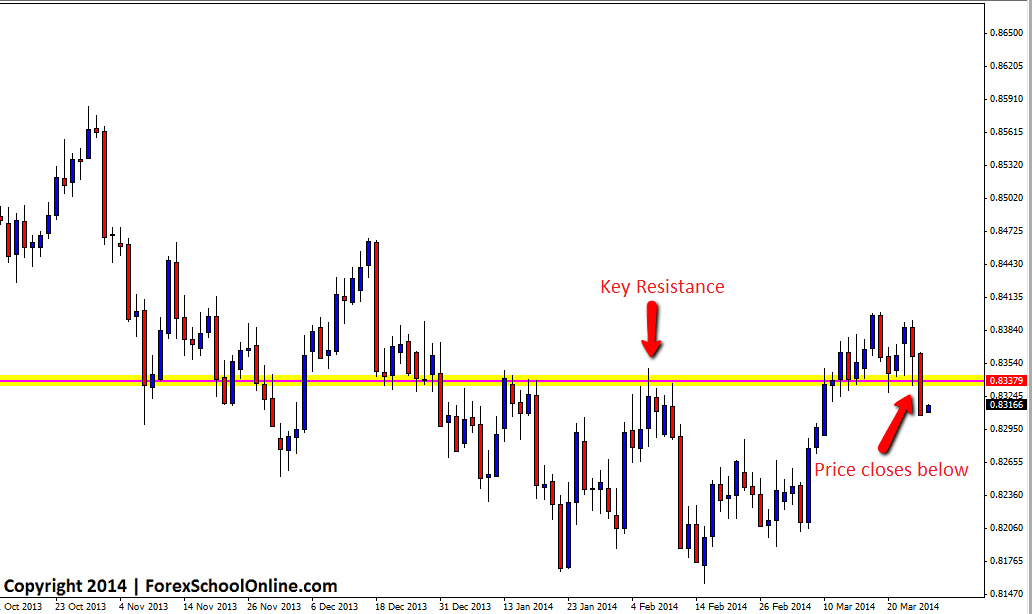
Price on the daily chart of the EURGBP has broken an important price flip support area on the daily chart and importantly closed below. As I discuss in this trading lesson here: The Lessons Traders Can Learn From Candlesticks & Price Action traders can often learn a heck of a lot from where price can and cannot close.
Now that price has moved and closed below this support area on the daily chart, it may flip and look to act as an old support and new resistance should price retrace higher to test the level again. If price does test this level again, it could provide a potential solid resistance area for price action traders to start looking for short trades.
As I discuss in a recent video which you can find here: Making Price Action Trades With Space if price does move into this area, then to make a trade on the daily chart would mean there would not be enough pull-back or retracement. The level would be a solid one to make a trade from, but there would be no space to make a trade. When confronted with this scenario, traders can move to their intraday charts and look for trades using the same level, but on charts such as the 4hr or 8hr or on rare occasions possibly even the 1hr. This ensures they are using a solid level to trade from, but can have space without a lot of traffic in the way of support and resistance to trade back into.
Any potential trades at this key level would need to be confirmed with high probability price action like the setups taught in the Forex School Online Price Action Course. If price does not fire off any price action at this new resistance and moves back above, it could then look to flip again and hold as a new support level once again.
EURGBP Daily Chart

Related Forex Trading Articles & Videos


Leave a Reply