EURCHF Analysis – Price Shows Signs of Change in the Market Trend
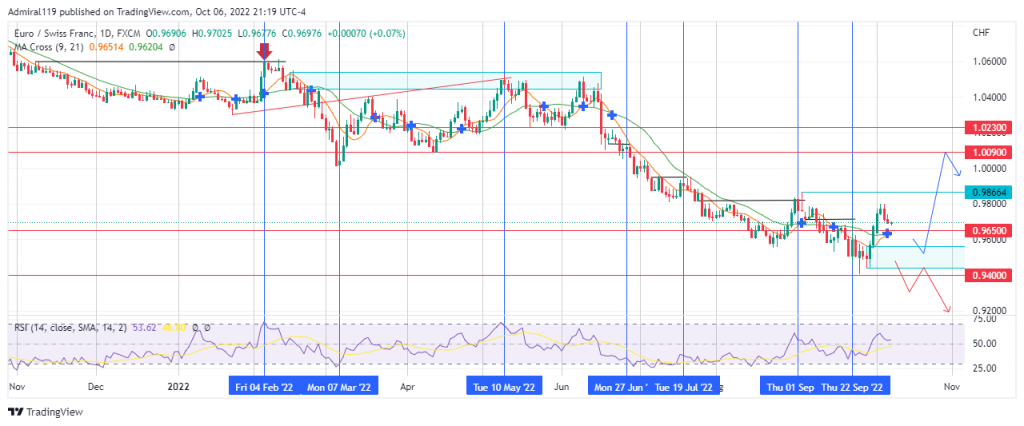
EURCHF has been declining ever since the market structure shifted last year. This bearishness resumed after a period of correction between February and June 2022. Ever since the end of the correction phase, the market has been descending aggressively down the crest.
EURCHF Significant Zones
Demand Zones: 0.9650, 0.9400
Supply Zones: 1.0090, 1.0230

As the market steadily declined down the crest from last year, it formed a double top at the 2022 high. This local high was formed on the 4th of February, 2022. After the formation of the double top, prices further declined rapidly into an oversold region on the 7th of March, 2022. The rapid price decline caused the bears to take a relatively long break from the market in February 2022. The EURCHF bears seized the market at this point and returned prices to a bearish order block.
The steady rally towards the bearish order block was down with respect to a trendline. The marubozu bearish candlestick formed as the EURCHF bears resumed the market, indicating a possible long-term downtrend. The market continued downward after each break of the structure to the downside. Until prices hit the demand zone in September 2022, the market remained bearish. Currently, there appears to be a potential market structure shift in the daily timeframe. This might lead to a trend reversal upward.

Market Expectation
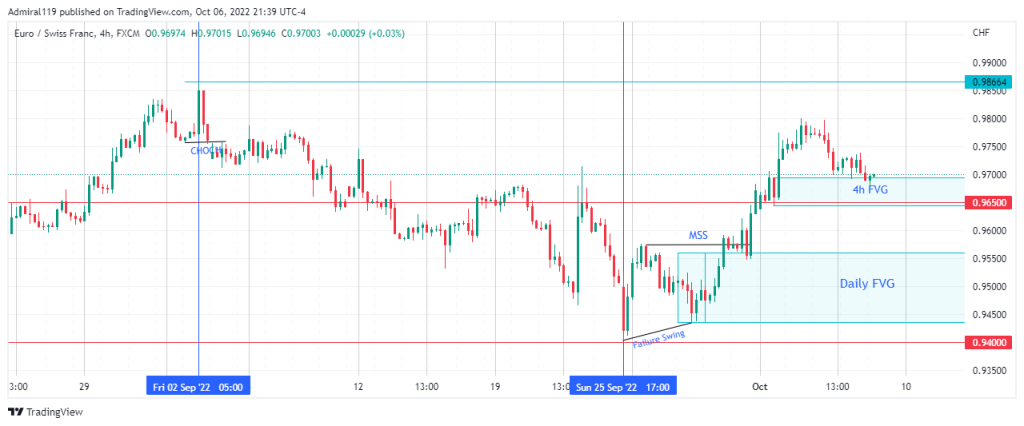
The current bullish trend was due to the failure of the swing and the market structure shift (MSS) formed on September 25, 2022. Either the four-hour Fair Value Gap (4h FVG) or the daily Fair Value Gap (Daily FVG) is expected to cause a retracement or reversal in trend. This might happen before or after the buy side liquidity above the old high at 0.98664 has been cleared off.
Note: Forexschoolonline.com is not a financial advisor. Do your research before investing your funds in any financial asset or presented product or event. We are not responsible for your investing results.


Leave a Reply