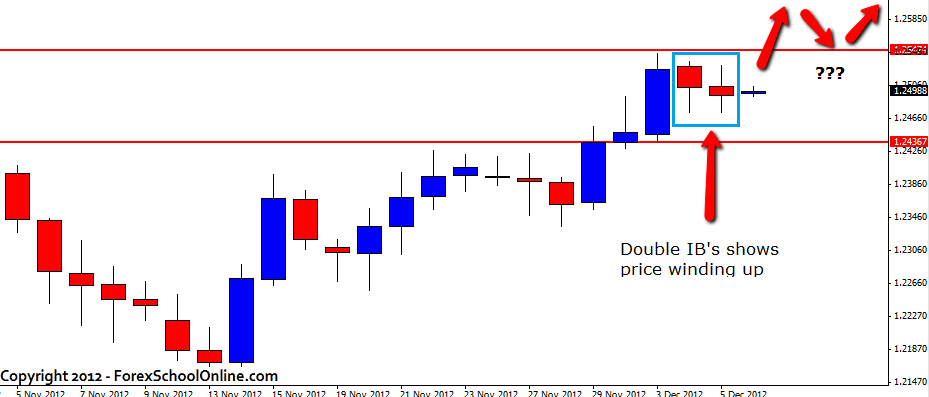
The EURAUD has now formed 2 Inside Bars (IB’s) back to back on the daily chart. This price action is signalling that price is winding up and a breakout either way is getting closer.
On this chart support and resistance comes in very close, and the best play may be to wait on the sidelines to see which way price breaks. Once price breaks out the picture will become a lot clearer as to whether traders should begin looking for longs or shorts.
The recent short term momentum and trend has been higher and the percentages will be on price breaking out higher. If price does break out higher, traders could look to get long with price retracing back to the old resistance. See chart:
EURAUD DAILY CHART – 6 DEC 2012


Leave a Reply