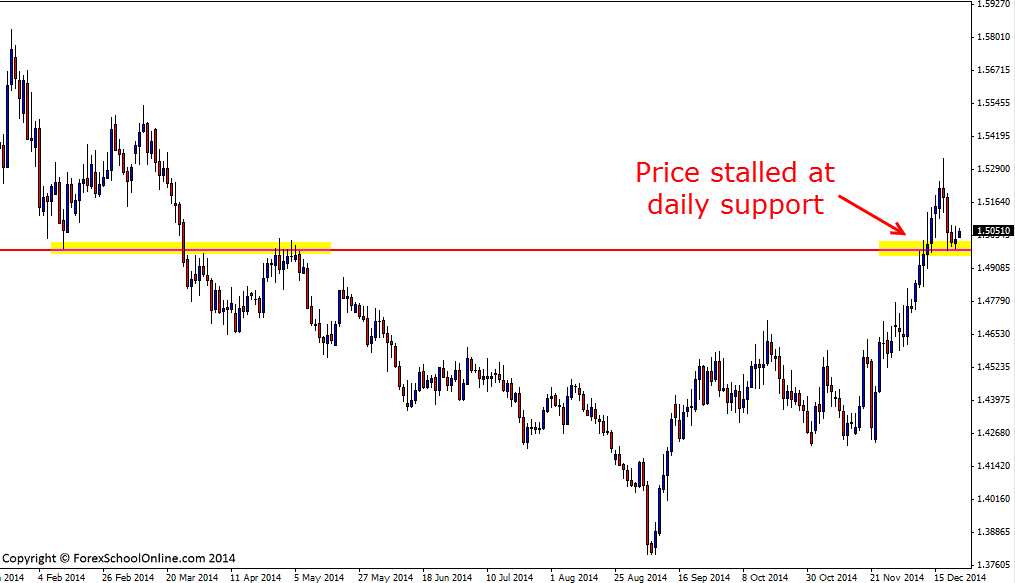
The EURAUD has stalled at a key support level on the daily price action chart. As the first daily chart that is zoomed out below shows; this key level has been a super important price flip level, flipping between acting as both a support and resistance in recent times. Price has been in a really strong trend higher, but after forming a large bearish rejection candle at the high, price has retraced lower and back into this key daily support area to be where it is now.
So far price has respected this support level and has started to stall or pause. This is very common when the market is in a phase of either indecision or consolidation for example; price makes a large move, price pauses/stalls to consolidate and then continues. In this scenario the trend is very much still intact and this stalling could just be price consolidating off the support level and building order flow for the next move higher.
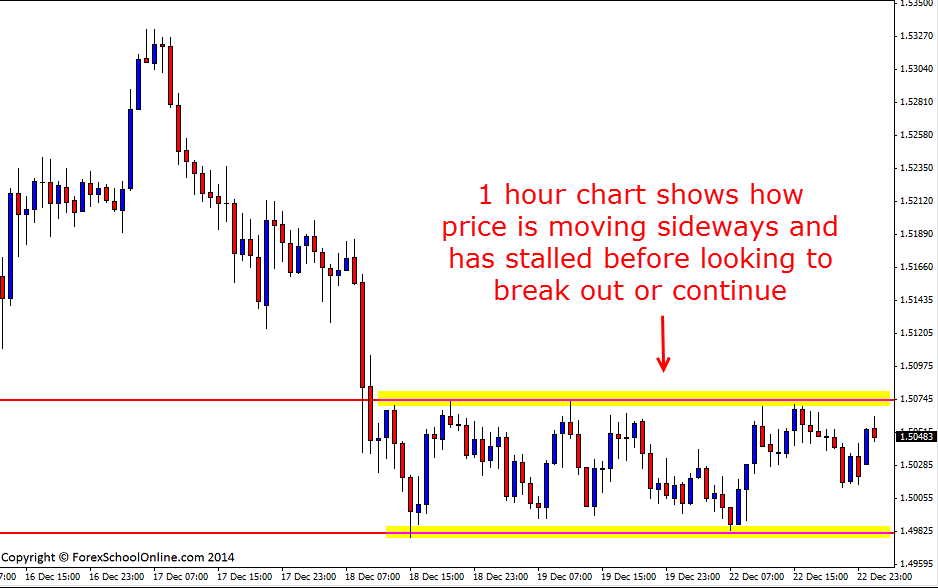
The 1 hour chart shows this stalling more clearly on an intraday chart and how it is formed. As this 1 hour chart shows; price is moving sideways and is contained within very clear barriers. For price to continue the trend, price will need to make a solid breakout and close above this consolidation area.
Daily EURAUD Chart

1 Hour EURAUD Chart


Leave a Reply