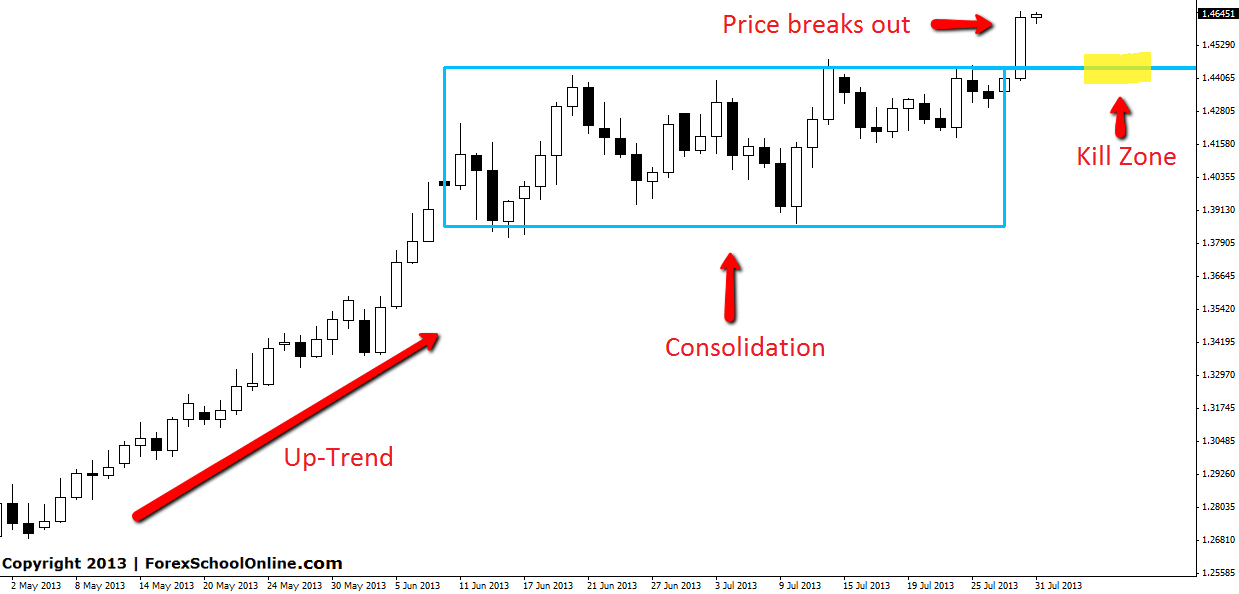
The EURAUD has finally broken out on the daily chart after weeks of being held in a consolidation box. Before this boxing, price had been in a very strong up-trend with price making higher highs and higher lows. Price will more often than not break out in the direction that price was trend in before it went into consolidation, like we have seen here. This is a general rule of how the markets often move. This is explained more fully here: Consolidation to Continuation Tutorial.
Now that price has broken out of this consolidation area, there is a lot of space for price to move into until price hits the next resistance area. Traders could now start looking for long trades to trade with this trend as long as price stays above this breakout area. The old breakout resistance area will now flip and look to hold as support and as long as that area holds as support traders could target that area to look for long trades. This support area could act as a kill zone for traders to traders to target a trade with the trend.
If price does not rotate all the way back to the support level, traders could look for long signals or continuation signals on the intra day charts to see if this pair is giving possible bullish signals or signs of wanting to continue higher. If the intraday charts start giving bearish price action signals then traders may want to wait to see how price reacts at the key support and kill zone as that is the critical area for this market.
You can read more about how to find price action “Kill Zones” in my latest article here: How to Trade Like a Sniper with Price Action Kill Zones
EURAUD DAILY CHART | 31 AUG 2013


Leave a Reply