EURAUD DAILY & 4 HOUR CHARTS
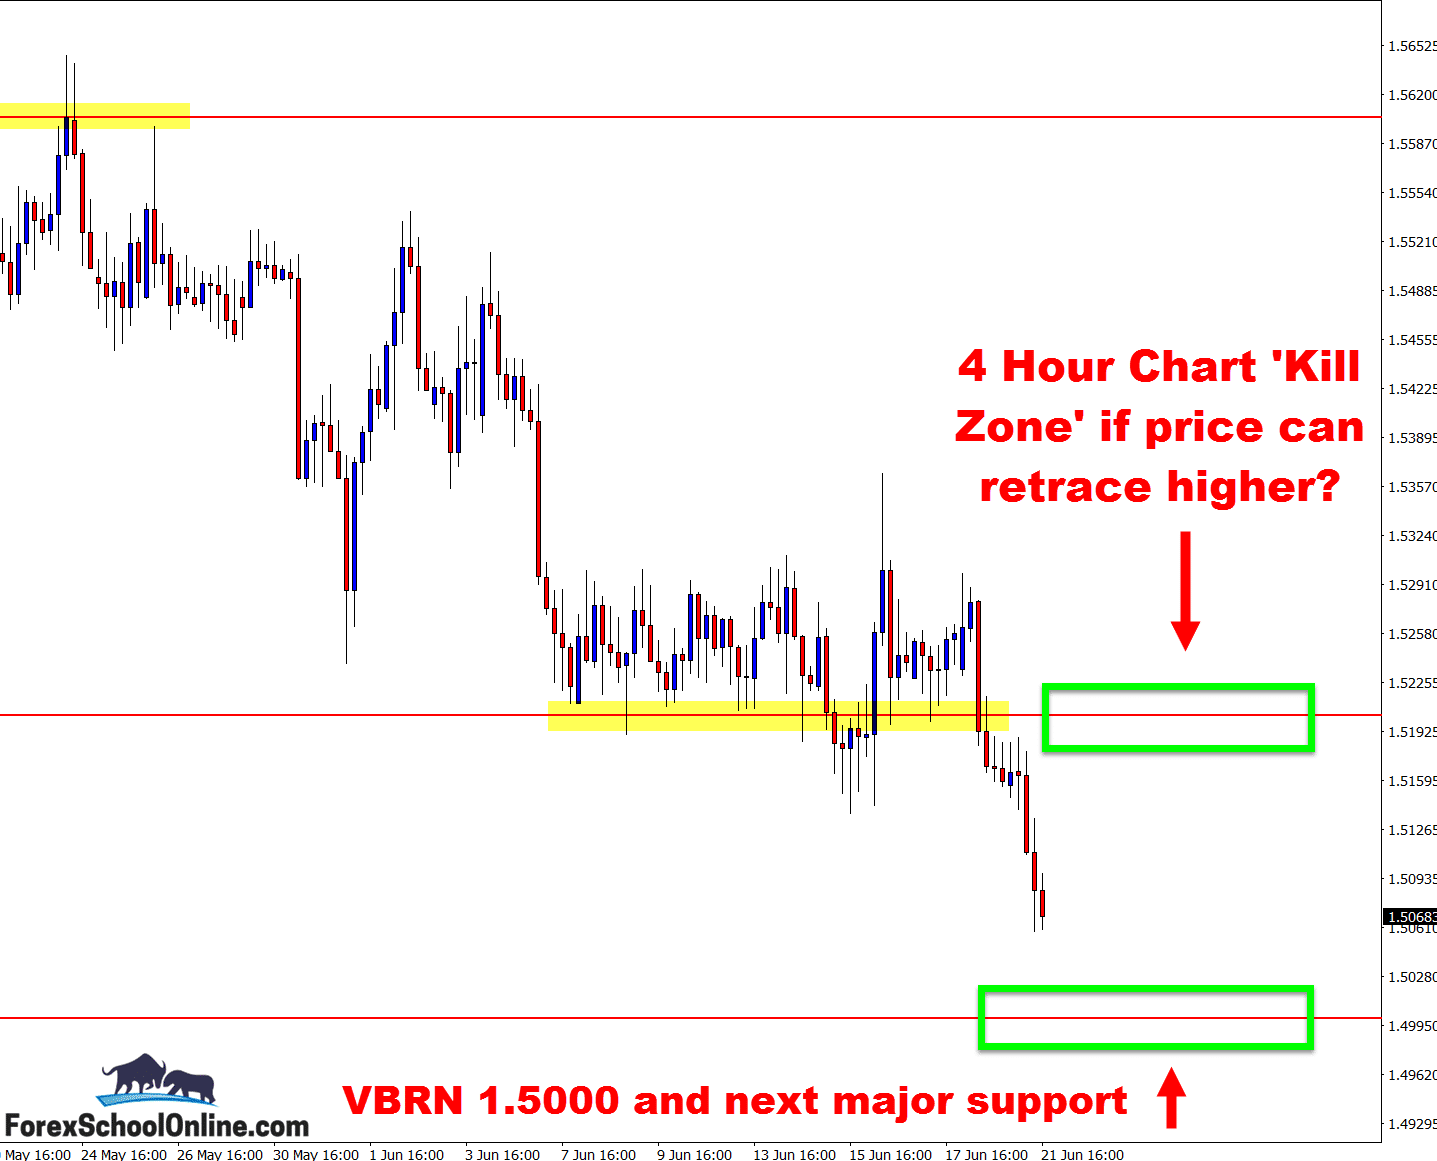
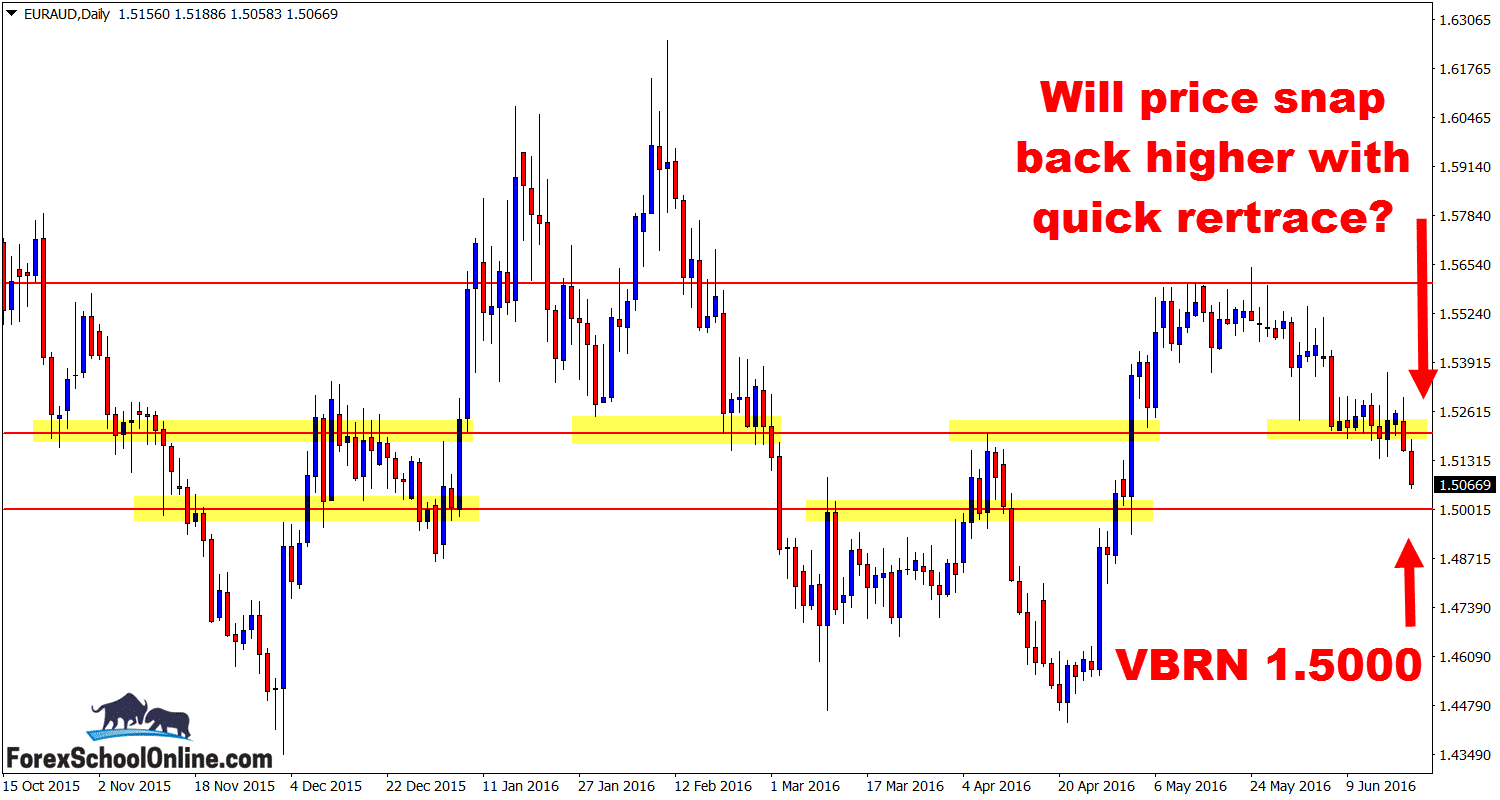
Price on the daily price action chart of the EURAUD has broken lower and is now between a major daily support level and a potential ‘Kill Zone’ overhead.
This is an interesting chart. Unlike price on the other pairs that I will discuss further down (especially CHFJPY) that have been moving in a solid trend of late, price in this market has been congested and moving sideways for some time now. However, that does not mean that we have to stop hunting for trades in this pair.
It just means we have to be aware of the market type and keep all these clues in our mind when we go hunting for trade setups. If price can pop higher and make a retrace into the potential ‘Kill Zone‘ (which you can see on the chart below as I’ve marked it), it could provide a really solid level to look for potential short trades.
If, however, price continues down with this recent break lower, then the next major support comes in around the Very Big Round Number (“VBRN”) of 1.5000, which is also a major daily support level.
I explain VBRN’s in a previous Forex Commentary Post here: How to Spot, Read, Use & Trade the Very Big Round Number.
Daily EURAUD Chart – Zoomed Out
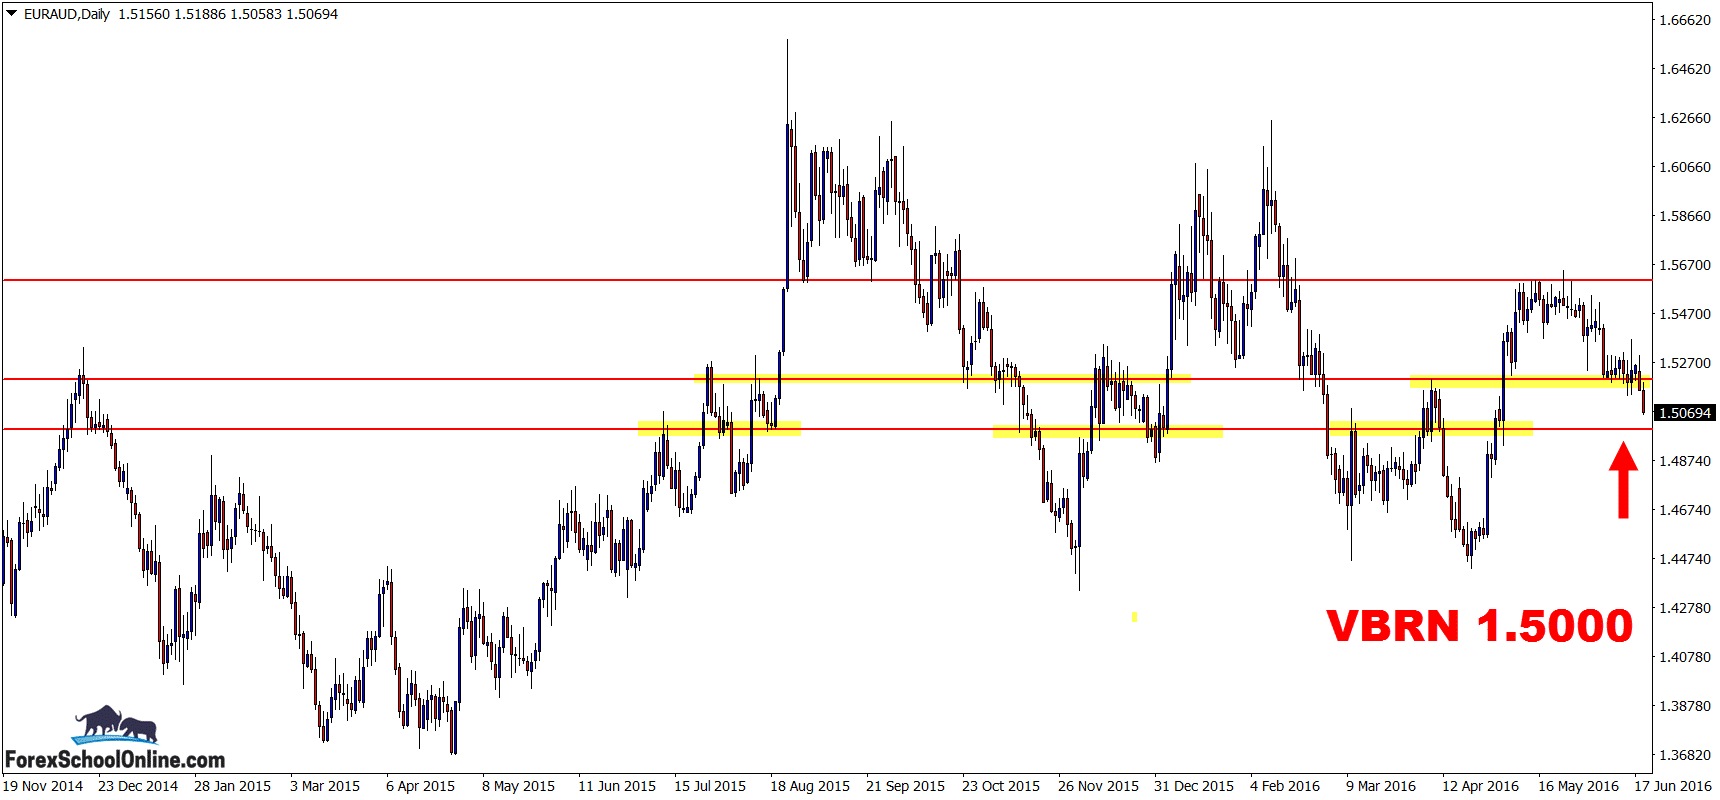
Daily EURAUD Chart
4 Hour EURAUD Chart
USDZAR DAILY CHART
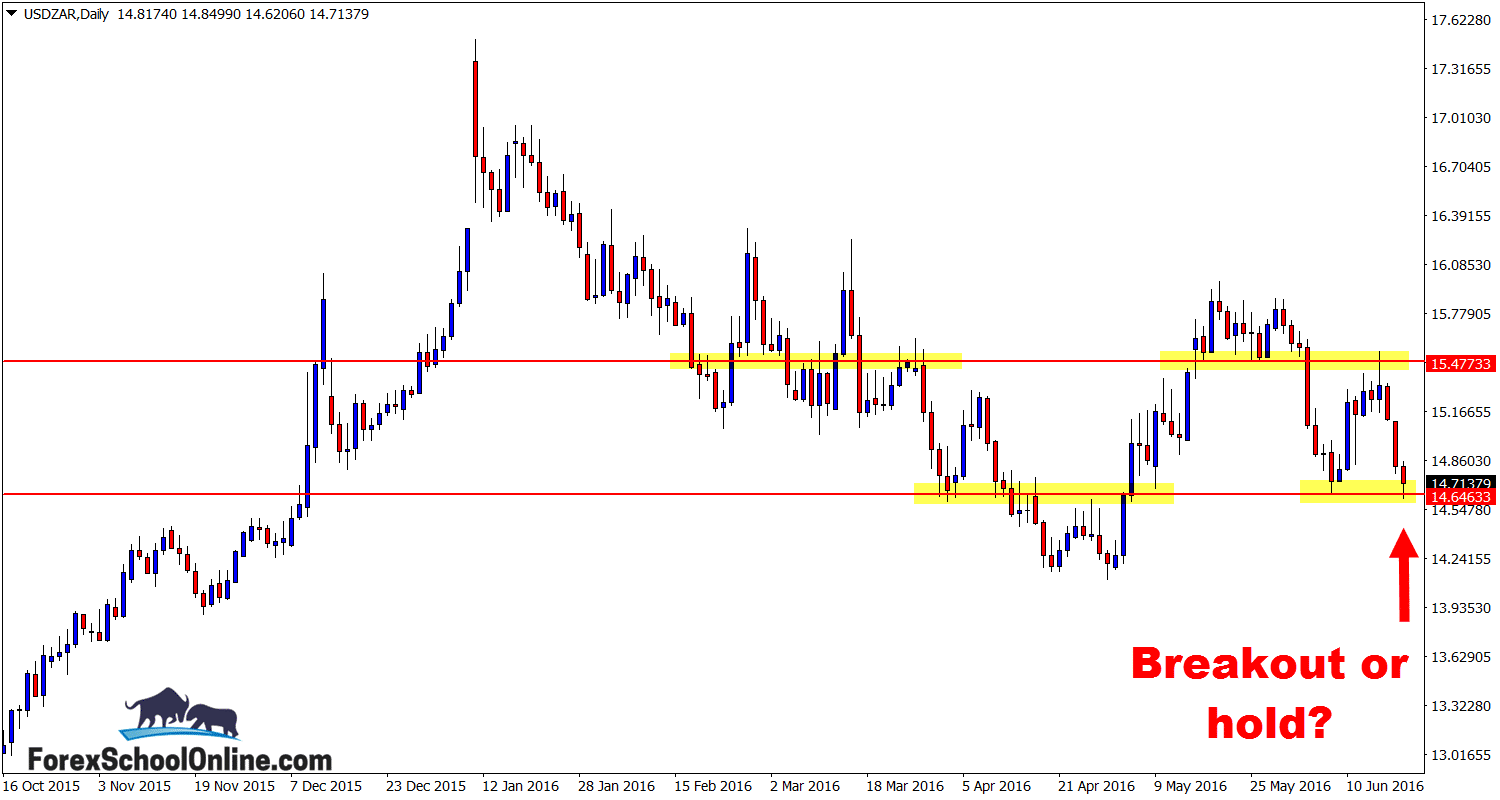
If price is going to be in a range or trading sideways, you want that range to have really clear levels with an obvious high and low.
In many markets, once they get into their ranging and sideways periods they will become so choppy and whippy that trading them becomes very high risk and it offers very few rewards.
As I went through above with the EURAUD, you can still trade ranging markets, you just have to make sure that you pass on the markets that offer very little opportunity. These are the ranging markets that have very little space to trade into, with nearly all of the candles having huge wicks on both sides of them and price not making sustained moves higher or lower. This makes it extremely hard to make any profits.
If you look at this pair, price had been in one of the clearest and most sustained trends in the Forex market. Over the last year price has been moving straight sideways. If you look at especially the last few months, price has been even tighter into this range and consolidation.
Saying that though, price still has clear highs and lows. It is giving traders a chance to make trades because there is space to trade into – if we move onto the intraday charts we could also hunt for trades at major daily levels.
Daily USDZAR Chart
CHFJPY DAILY & 4 HOUR CHARTS
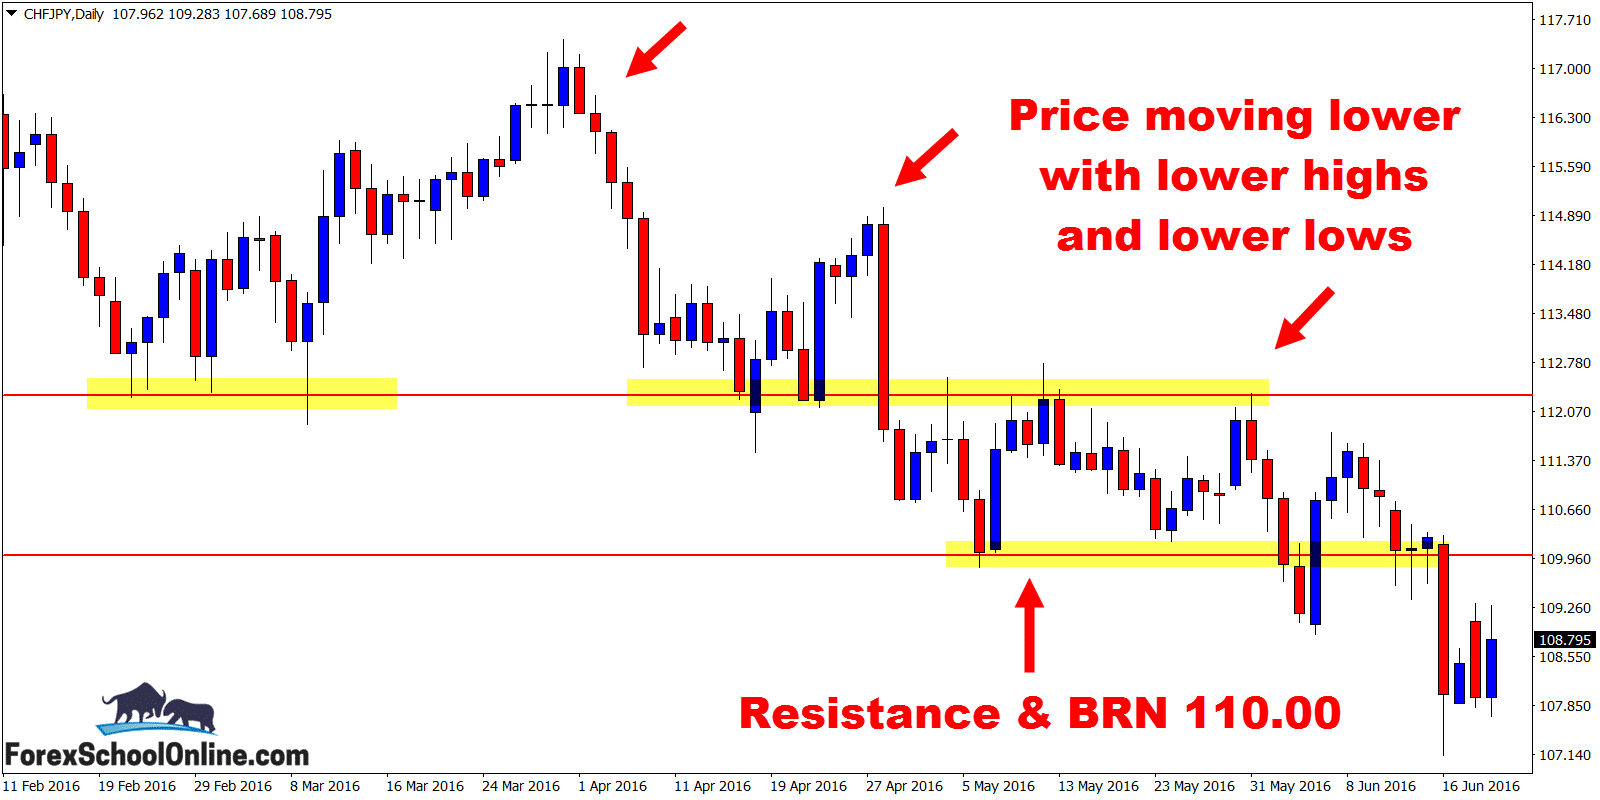
Price on the CHFJPY has been moving lower on the daily chart for some time now. As you can see on the daily chart below, price has been making a series of lower highs.
Price has now broken lower and through a major daily support level that is also a Big Round Number of 110.00. Should price be able to pop back higher, it could potentially be a solid area to hunt for short trades on both the daily or intraday time frames such as the 8 hour or 4 hour charts.
You will notice that at this level before breaking and closing through lower, price paused and formed and inside bar (“IB”), highlighting or giving a clue as to the importance of this level. If we are to take any trades at this level we would need to confirm them with high probability A+ trigger signals like the ones taught in the Forex School Online Price Action Course.
Daily CHFJPY Chart
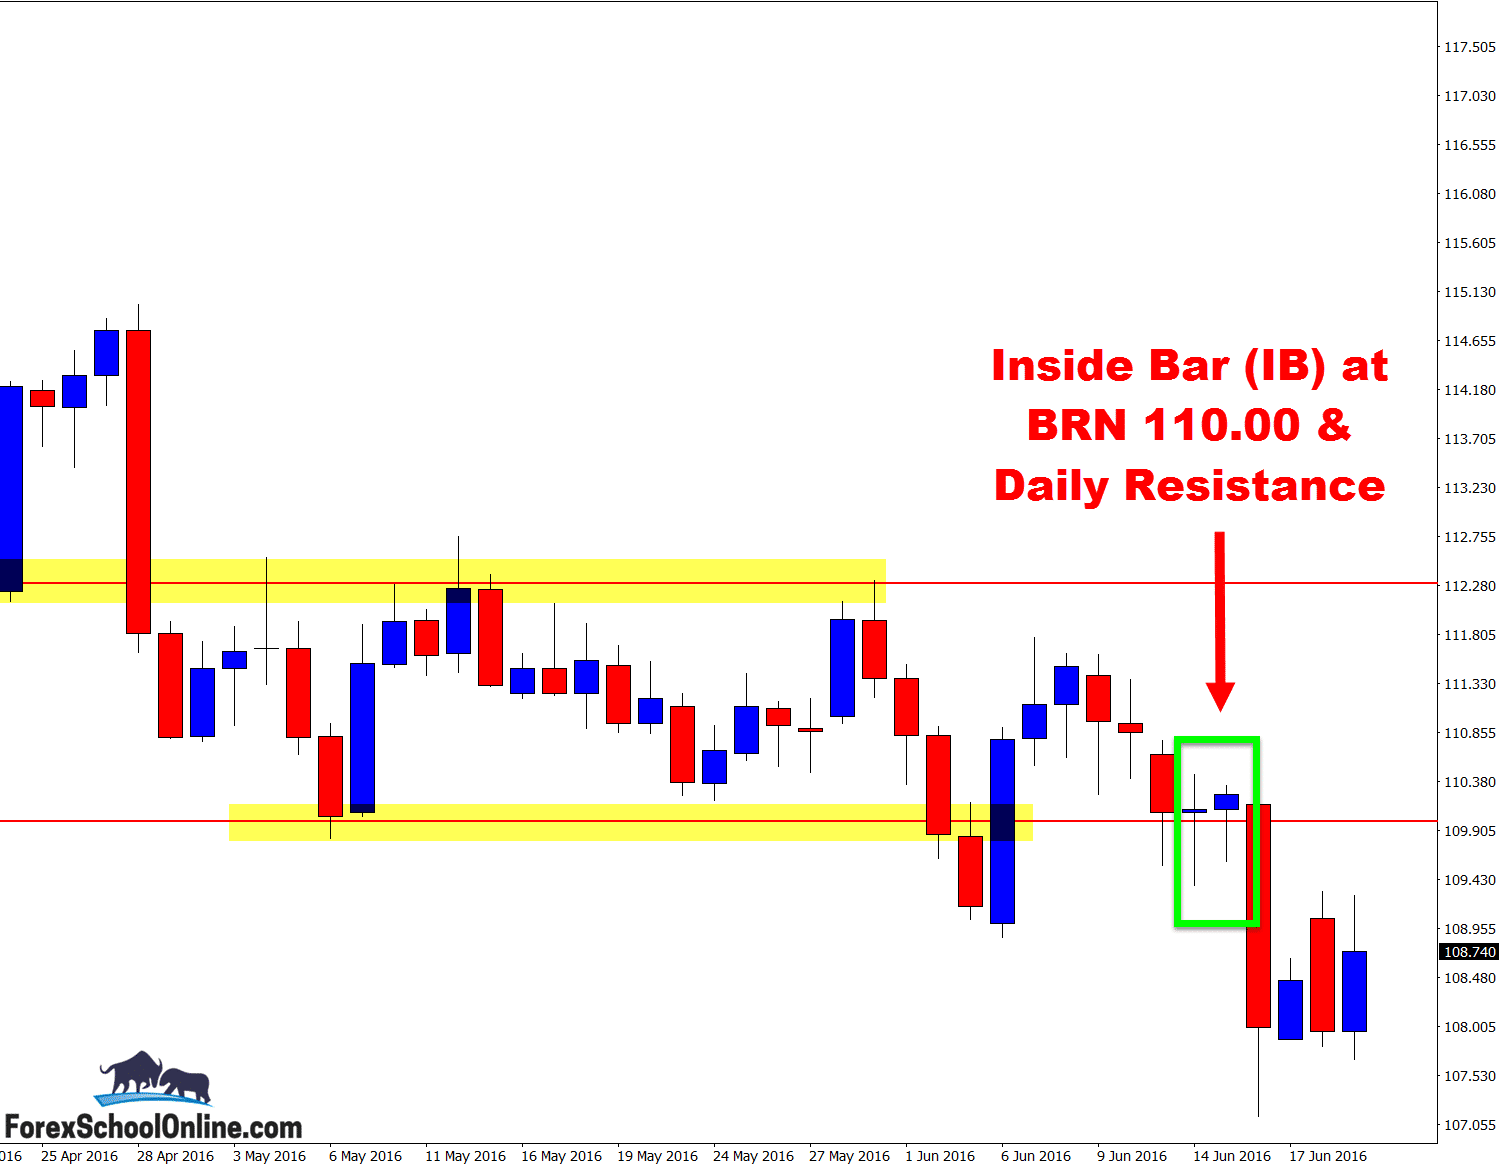
Daily CHFJPY Chart
Related Forex Trading Education


Leave a Reply