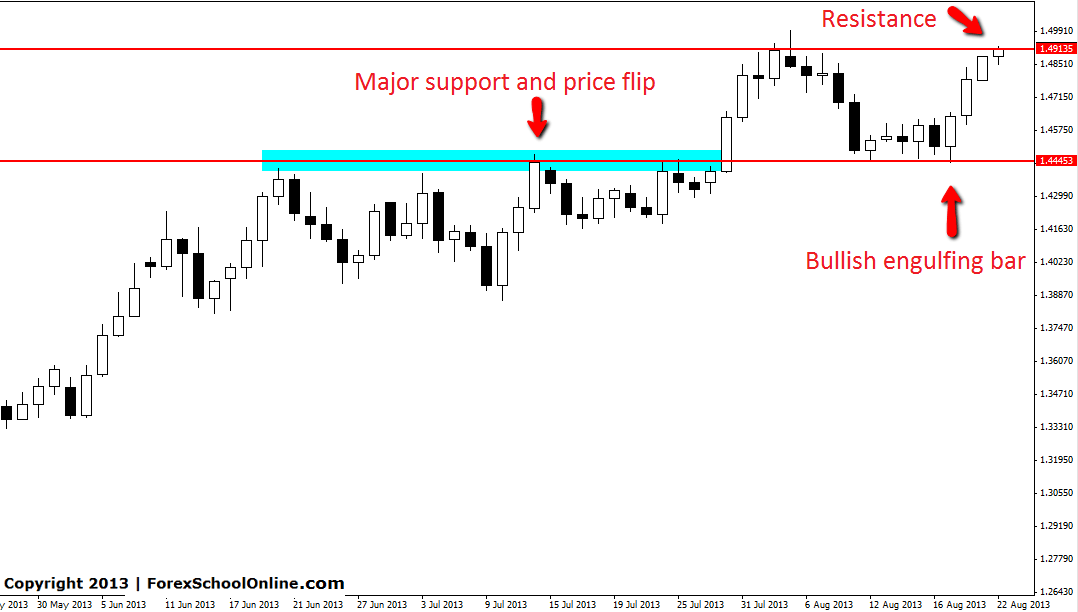
Price has soared higher on the EURAUD daily chart after forming a bullish engulfing bar (BUEB). This setup was posted live on this blog as it was forming on Tuesday 20th August and you can see the original post HERE.
This BUEB was a high probability price action setup because it had many factors lining up it’s favour. As I talk about in a lot of my posts in this blog, the biggest edge a trader can put in their favour is trading with the trend and this BUEB was with the clear up-trend. The next major plus that this trade had in it’s favour was that it was at a major support price flip area. This area was a previous old resistance area that has now held as a new support area.
After price moved through and broke the high of the BUEB, price quickly moved higher and into the near term resistance area. Price is now testing the recent highs and this has given traders who took this trade a chance to either take profit or at the minimum protect their capital by shortening their stops.
EURAUD DAILY CHART


Can I ask that (BUEB)
What does that mean?
Bullish Engulfing Bar
Hi
This is the 12h chart on eur/aud , I think we’d a pinbar that we could play with a very shorter stoploss . is it correct ?
Thanks
Hello,
are you saying you see a 12 hr pin on your charts? Are you using Ny close charts?
https://www.forexschoolonline.com//new-york-close-5-day-forex-charts-change-time-frames-mt4/