EURAUD 8 Hour False Break Pin Bar Reversal
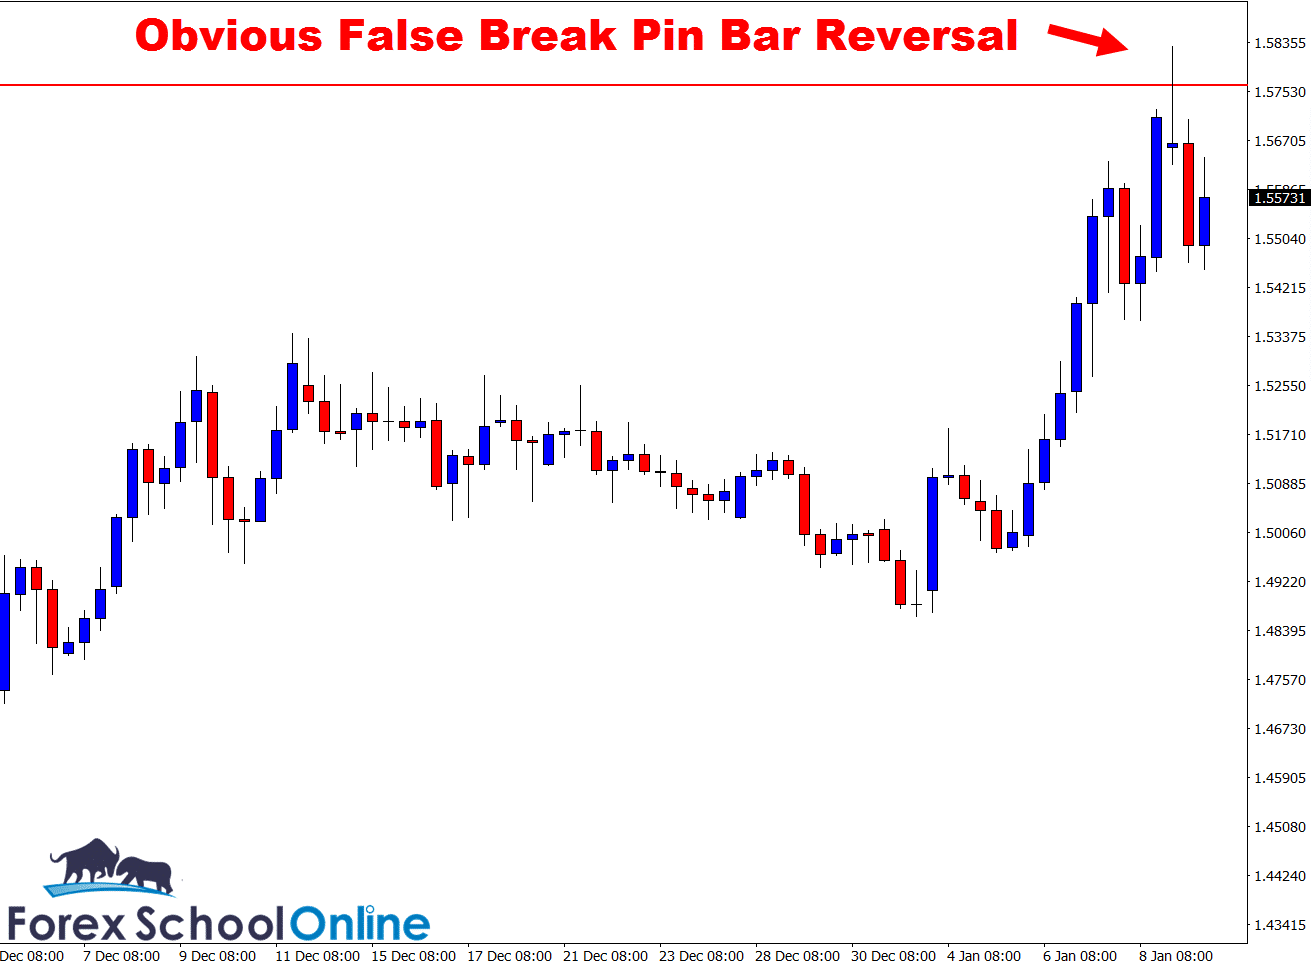
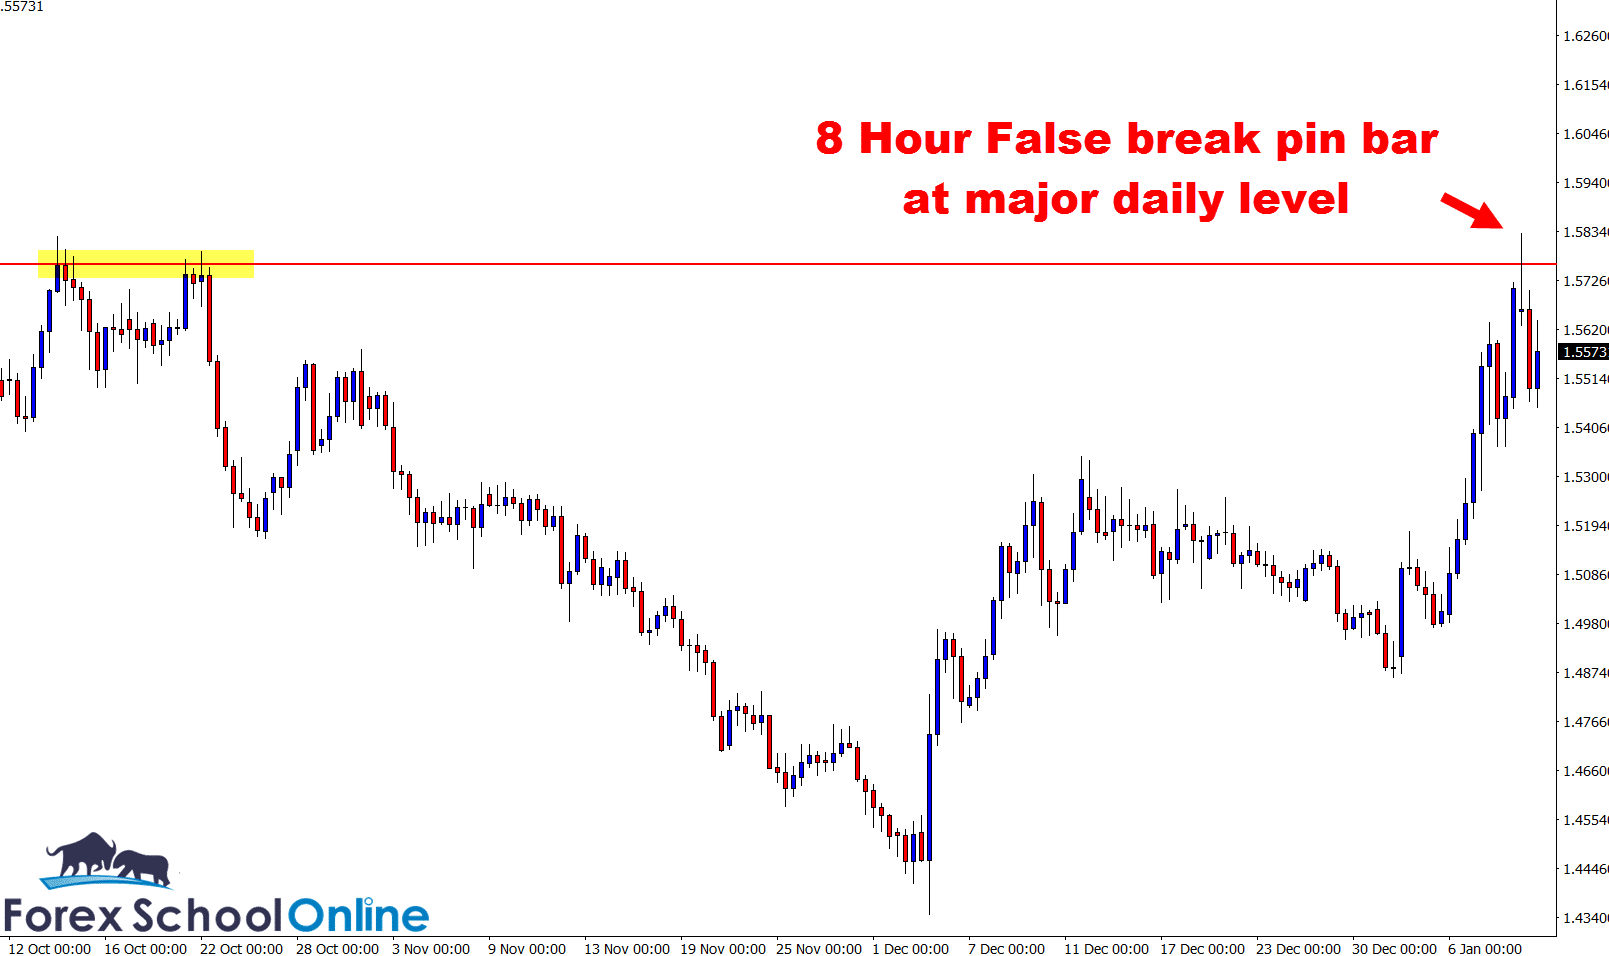
Price on the 8 hour chart of the EURAUD has popped lower after forming a false break pin bar reversal at a major daily resistance level. As the daily chart shows below, this false break candle (which had a major proportion of the market faked into breaking out higher), was rejecting a major daily level price flip level. This level in previous times held as both a key support and resistance.
As I have marked and noted on my 8-hour chart of this pair for you below to try and highlight, this 8 hour false break pin bar was a really obvious and clean cut setup. Whilst in recent times price had been moving higher and there had been a strong leg higher, this rejection and false break did have a clear path for price to make a move into the near term support.
Where price goes to from here, I am not sure, because as I just said, price has been moving strongly higher or late. The overhead resistance is a strong one though, so it could be an interesting price action battle to keep an eye on.
8 Hour Chart – Pin Bar Reversal

8 Hour Chart – False Break

GBPSGD Time to Hunt For Short Trade Setups?
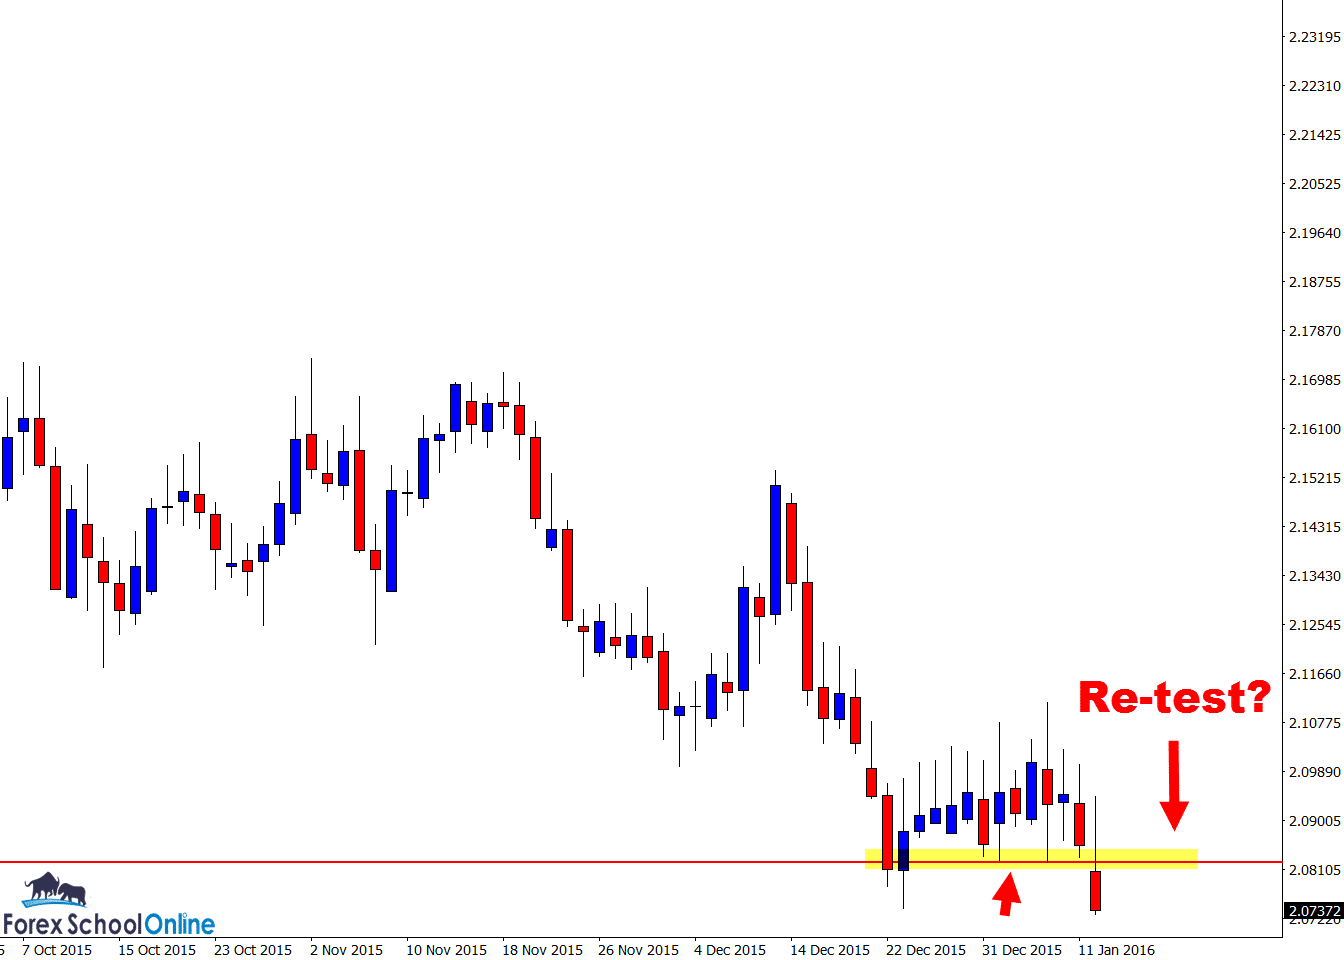
Price action on this chart is playing out a really interesting story just at the moment I recommend you keep a close eye on if you are interested on hunting high probability breakout and re-test trade setups which I am. As I write this daily Forex commentary for you, price is making a really strong breakout lower, through the major support level of the daily chart.
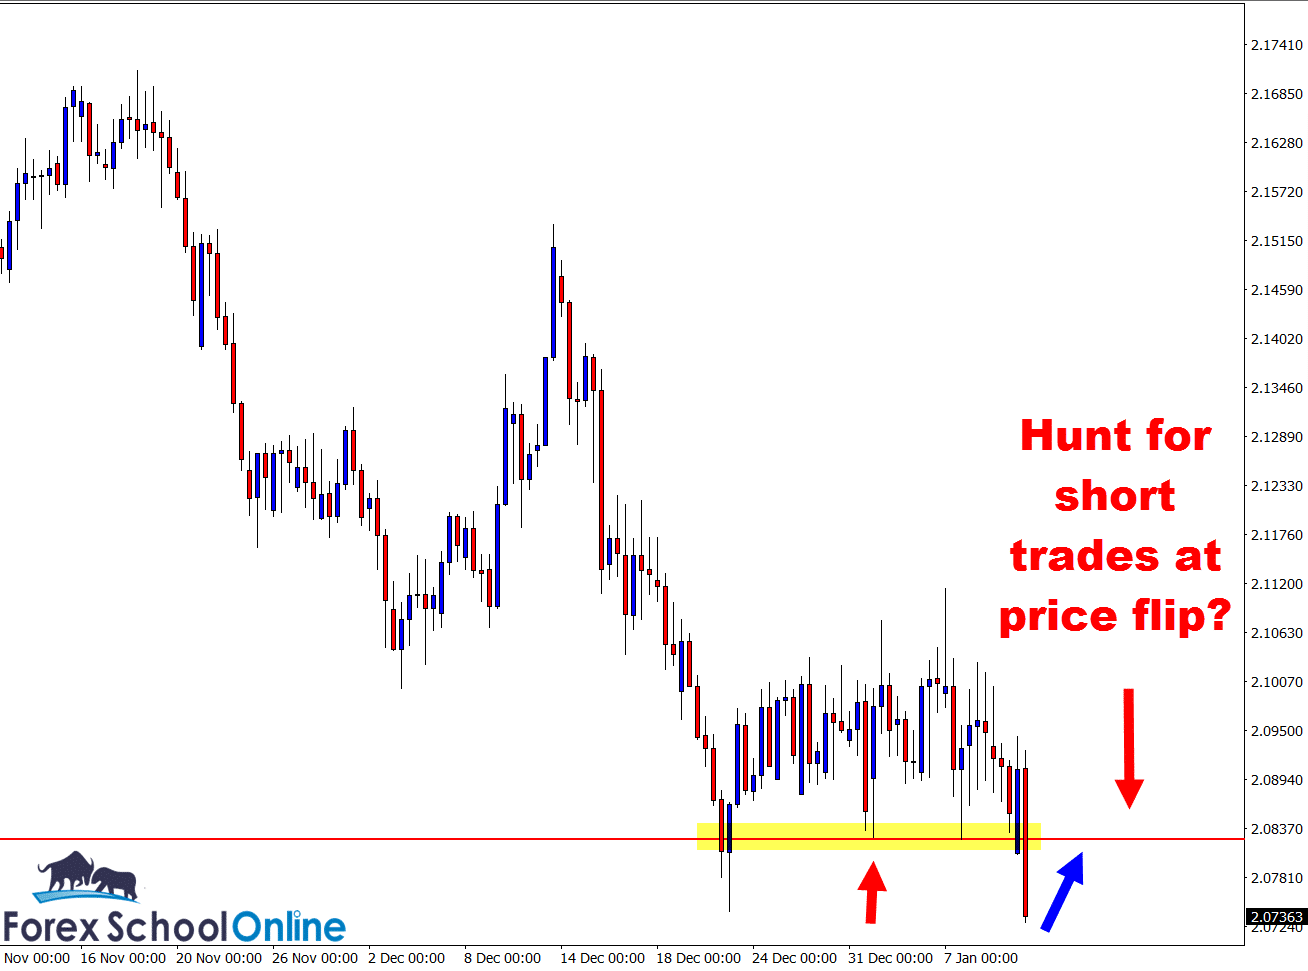
As you can see on both my daily and 8 hour charts that I have attached for you; this support level is a super important one that was containing price from breaking lower. Price is now smashing through this level and this level could be a really key level for looking to make short trade setups.
If price can make a quick retrace or rotation back higher and into the old support and potential new resistance level, then we can look to make short trades at the new price action flip level. For any short trades to be triggered or entered into we would need to have a high probability A+ bearish trigger signal, just like the example above in the EURAUD 8 hour false break.
Daily Chart – Re-test Major Level?

8 Hour Chart – Hunt For Short Setups?

Want to Change the Time Frame of Your MT4 Charts? Do you want to know how to make your MT4 charts into an 8 hour chart like I have done in today’s post? Or a 2 day chart, or any time frame chart you want? To make any time frame you want using the MT4 platform, read this lesson;
Change MT4 Time Frame EA Indicator
Related Forex Trading Education
- How to Trade the False Break Pin Bar Reversal *Live Trade Video*


Leave a Reply