• Skip to primary navigation
  • Skip to main content
  • Skip to primary sidebar
  • Skip to footer

ForexSchoolOnline.com

Learn to Trade Forex Online

  • Compare Brokers
    • Broker Type
      • Paypal Brokers
      • Swap-Free Brokers
      • Low Spread Brokers
      • ECN / STP Brokers
      • Market Maker Brokers
      • Non Dealing Desk Brokers
      • Low Minimum Deposit Brokers
    • Country
      • Brokers for Australia
      • Brokers for South Africa
      • Brokers for the UK
      • Brokers for the US
      • Brokers for Nigeria
    • Regulation
      • FCA Regulated Brokers
      • ASIC Regulated Brokers
      • FSCA Regulated Brokers
      • CFTC Regulated Brokers
    • Platform
      • MT4 Brokers
      • MT5 Forex Brokers
    • Strategies
      • Hedging Forex Brokers
      • Scalping Forex Brokers
      • Carry Trade Forex Brokers
      • Brokers for Indicators and EA’s
  • Start Here
    • Start Trading Guide
    • Beginner Trading Lessons
  • Free Forex Course
    • Public Login
    • Register
    • Password recovery
  • Lessons
    • Strategies
    • Videos
    • MT4 Guides
    • Money Management
  • Trade Setups
  • Tools
    • Correct Free Demo Charts
    • Forex Journal Download
    • Position Size Calculator
    • FULL List of Tools
    • Forex Demo Accounts
  • Price Action Guide
  • Free Course

EUR/JPY Rebounds off the 78.60 Fibonacci Support Level

Johnathon Fox
03/22/2023 | UPDATED ON: 03/22/2023

EUR/JPY price action crashed through the 50 and 61.80 Fibonacci support levels exactly seven trading sessions ago. This downward price retracement started when the pair’s price poked through the 146 mark to test the 147-price level. However, the price’s downward retracement was abated at the 78.60 Fibonacci level. At this point, price movement in this market seems to have retraced from a higher mark.

Major Price Levels:
Top Levels: 142.12, 144.00, and 145.00
Floor Levels: 141.00, 140.00, and 139.00

EUR/JPY Rebounds off the 78.60 Fibonacci Support Level

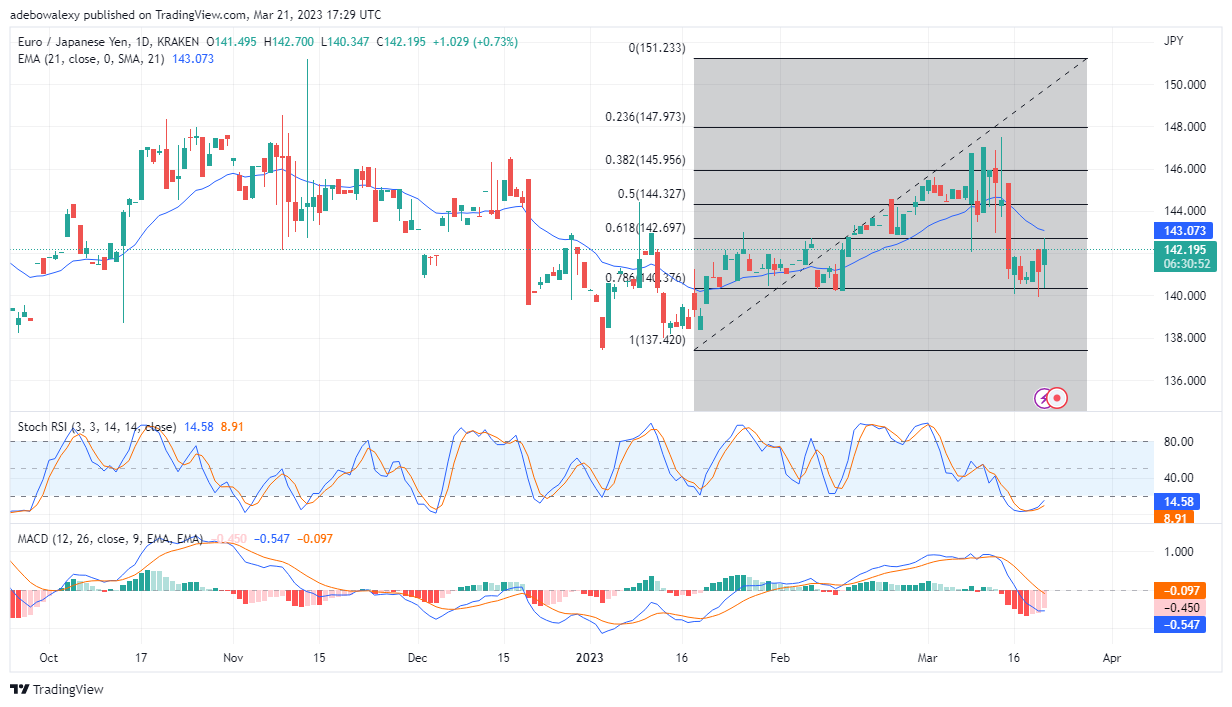
The EUR/JPY Price Is Eyeing the 143.00 Price Level

The EUR/JPY price movements seem to have triggered some long orders as it tested the 140.37 mark. The last price candle on this daily chart is now testing the 142.69 price resistance level. Although this may be seen as a retracement, signs on the RSI and the MACD appear to synchronize with each other. The lines of the RSI are rising smoothly upwards from deep in the overbought zone. Also, the display on the MACD indicator points out that bears are growing weak. The MACD indicator bars have turned pale red, and the lines are now moving toward each other. The histogram bars on the MACD are growing shorter, which indicates that sellers are losing momentum. Consequently, this is pointing out that price action is likely to gain more upside traction.

EUR/JPY Rebounds off the 78.60 Fibonacci Support Level

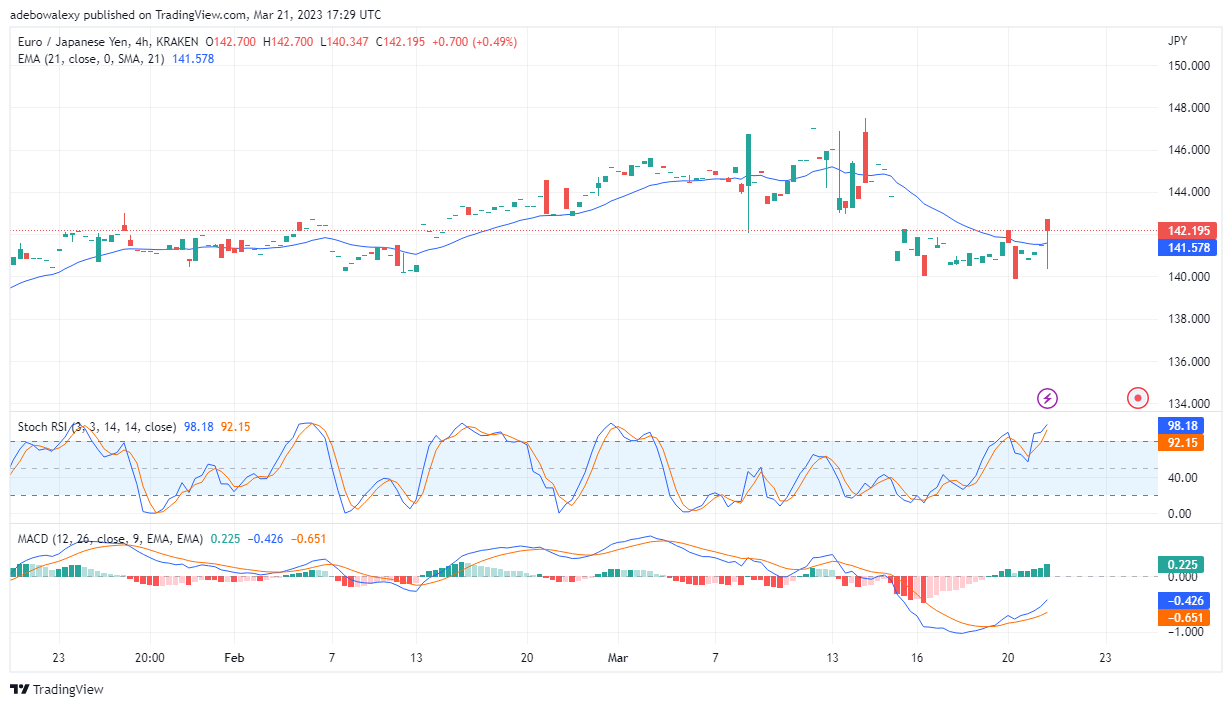
EUR/JPY Price Movements Seem to Be Defying Headwind

Price movements in the EUR/JPY 4-hour market appear to be defying downward forces. On this chart, it could be noticed that dashed price candles have been appearing in previous sessions. However, the last price candle here is a bearish one, yet it rose past the 21-day EMA line. Likewise, the MACD and RSI curves are still rising higher despite the appearance of the last bearish price candle. The Stochastic RSI indicator curves have risen significantly into the overbought region. Furthermore, the MACD curves are rising towards the 0.00 level of the indicator. Also, green histogram bars can now be seen growing taller above the 0.00 level to indicate increasing upside momentum. Summing up all market signs, traders can expect the price to recover the $145.00 mark.

Do you want to take your trading to the next level? Join the best platform for that here.

Recommended Broker

  • Broker
  • Min Deposit
  • Benefits
  • Score
  • Visit Broker

$200

T&Cs Apply
  • The Lowest Trading Costs
  • 50% Welcome Bonus
  • Award-winning 24 Hour Support
5
Trade Now FreeBets Reviews
Reviews

About Johnathon Fox

Johnathon is a Forex and Futures trader with over ten years trading experience who also acts as a mentor and coach to thousands and has written for some of the biggest finance and trading sites in the world.

View all posts by Johnathon Fox →
Previous Post: « Lucky Block Price Prediction: LBLOCKUSD Price Remains Strong above the $0.0001972 Supply Value
Next Post: Bitcoin (BTCUSD) – Bulls are in Charge »

Reader Interactions

Leave a Reply Cancel reply

Your email address will not be published. Required fields are marked *

Primary Sidebar

Forex School Online

High Probability Price Action Trading

How to make, manage and take profit from trades in the markets

Start Learning (It's Free!)

Turn Your Trades into Winners!

The Price action course is the in-depth advanced training on assessing, making and managing high probability price action trades.

Sign up for Free!

Recommended Broker

  • Broker
  • Min Deposit
  • Benefits
  • Score
  • Visit Broker

$200

T&Cs Apply
  • The Lowest Trading Costs
  • 50% Welcome Bonus
  • Award-winning 24 Hour Support
5
Trade Now FreeBets Reviews
Reviews

Footer

Get Our FREE Course, Bonus Strategies & Indicators!
X
Join Us Now!

Your capital is at risk.

X

CORNERSTONE LESSONS

Forex Trading for Beginners

Price Action Trading

How to Trade Forex

Technical Analysis

Forex Charts

Forex Trading Strategies

Money Management 

Compare Brokers

Best Forex Brokers

Forex Demo Accounts

Best Forex Trading Platforms

Forex Apps

Swap Fee Accounts

MT4 Brokers

CATEGORIES

Forex Videos

Trading Lessons

Weekly Trade Ideas

Start Here Guide

ForexSchoolOnline.com helps individual traders learn how to trade the Forex market

WARNING: The content on this site should not be considered investment advice and we are not authorised to provide investment advice. Nothing on this website is an endorsement or recommendation of a particular trading strategy or investment decision. The information on this website is general in nature so you must consider the information in light of your objectives, financial situation and needs.

Investing is speculative. When investing your capital is at risk. This site is not intended for use in jurisdictions in which the trading or investments described are prohibited and should only be used by such persons and in such ways as are legally permitted. Your investment may not qualify for investor protection in your country or state of residence, so please conduct your own due diligence or obtain advice where necessary. This website is free for you to use but we may receive a commission from the companies we feature on this site.

We Introduce people to the world of currency trading. and provide educational content to help them learn how to become profitable traders. we're also a community of traders that support each other on our daily trading journey

Forexschoolonline.com is not a financial advisor. Do your research before investing your funds in any financial asset or presented product or event. We are not responsible for your investing results.

Copyright © Forex School Online Sitemap  - Privacy Policy - Disclaimers & Terms of Use - CONTACT US