EUR/JPY Long-Term Analysis: Bearish
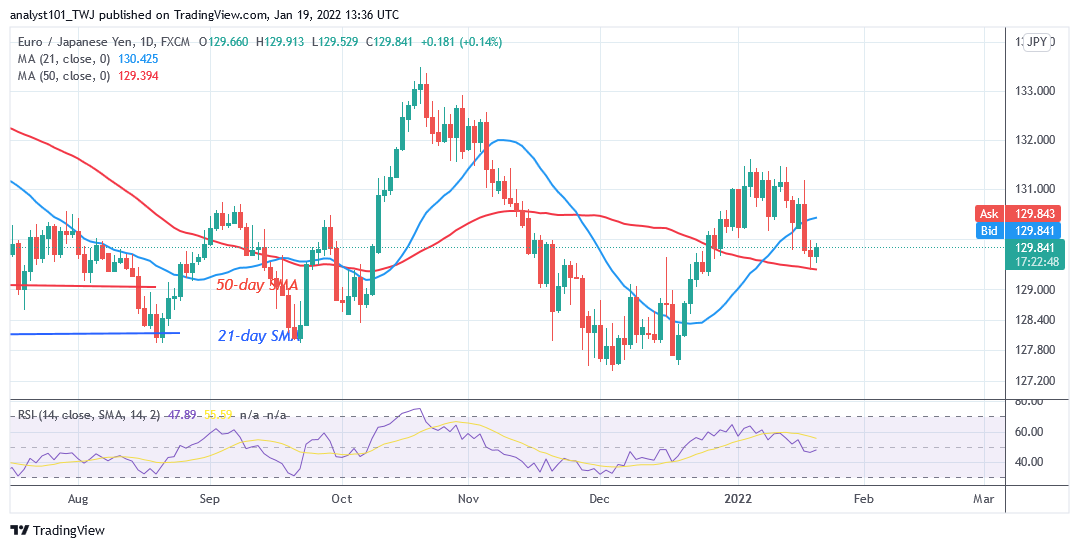
EUR/JPY pair is in a downward move but poises for upward move soon. The currency pair has broken below the moving averages. It is below the 21-day SMA but above the 50-day SMA. The pair is likely to be range-bound between the moving averages. Nonetheless, the downtrend will resume if price breaks below the 50-day SMA. Similarly, if the bulls break above the 21-day SMA, it will signal the resumption of the uptrend. Today, EUR/JPY is rising to the upside as price finds support above the 50-day SMA. The currency pair will resume trending when the range-bound levels are breached.
EUR/JPY Indicator Analysis
The pair is at level 48 of the Relative Strength Index for period 14. It indicates that the pair is in the downtrend zone and below the centerline 50. The currency price is between the moving averages indicating that the market will resume a range-bound move.EUR/JPY is above the 25% range of the daily stochastic. The pair is in a bullish momentum.

Technical indicators:
Major Resistance Levels – 133.00, 134.000, 135.000
Major Support Levels – 128.000, 127.000, 126.000
What Is the Next Direction for EUR/JPY?
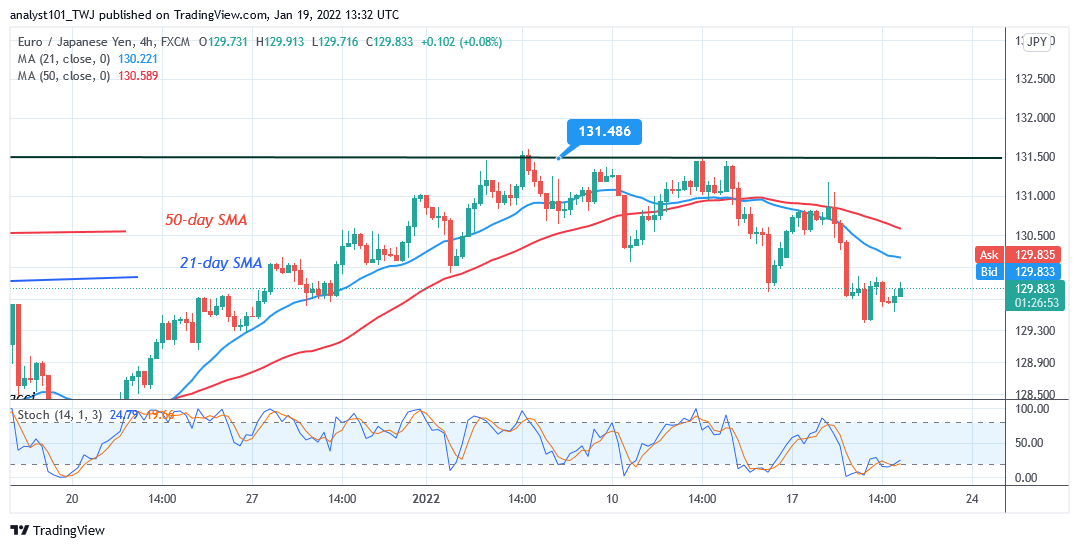
On the 4-hour chart, EUR/JPY is in a sideways trend but poises for upward move soon . The pair retested level 131.50 resistance level and commenced a range-bound move. Today, the sideways move has resulted in a downtrend as price breaks below the moving averages. The market has declined to the low of level 129.39 as bulls bought the dips. The bears are retesting the previous low as the altcoin resumes upward.

Note: Forexschoolonline.com is not a financial advisor. Do your research before investing your funds in any financial asset or presented product or event. We are not responsible for your investing results


Leave a Reply