EUR/JPY Long-Term Analysis: Bullish
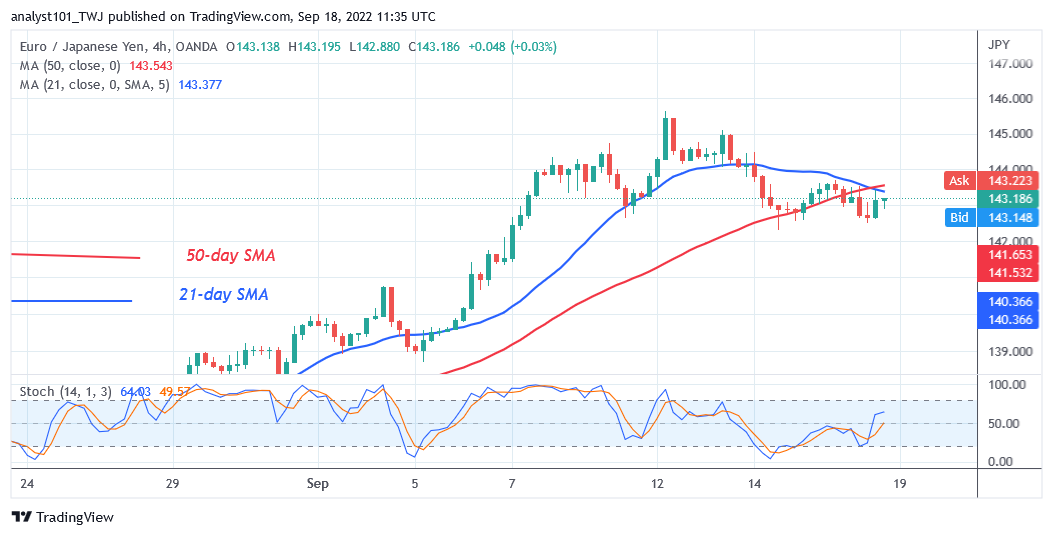
EUR/JPY pair is still in the bullish trend zone but declines to 142.29 low. Buyers have failed to breach the overhead resistance at level 144.00. The currency pair is likely to decline as it faces rejection in the overbought region. In previous price action, the Yen was repelled on June 8 and 21 as buyers retested the overhead resistance at level 144.00. Today, EUR/JPY has declined to the low of $142.29 at the time of writing.
EUR/JPY Indicator Analysis
EUR/JPY is at level 61 of the Relative Strength Index for period 14. It indicates that the Yen is trading in the bullish trend zone and capable of a further upward move, The 50-day line SMA and the 21-day line SMA are sloping horizontally indicating a sideways trend. The pair is above the 50% range of the daily stochastic. The Yen is in a bullish momentum.

Technical indicators:
Major Resistance Levels – 133.00, 134.000, 135.000
Major Support Levels – 128.000, 127.000, 126.000
What Is the Next Direction for EUR/JPY?
EUR/JPY is in a sideways move but declines to 142.29 low. On the 4 –hour chart, the currency price has broken below the moving average lines and resumes upward. The selling pressure will resume if the pair turns down from the moving average lines.

Note: Forexschoolonline.com is not a financial advisor. Do your research before investing your funds in any financial asset or presented product or event. We are not responsible for your investing results


Leave a Reply