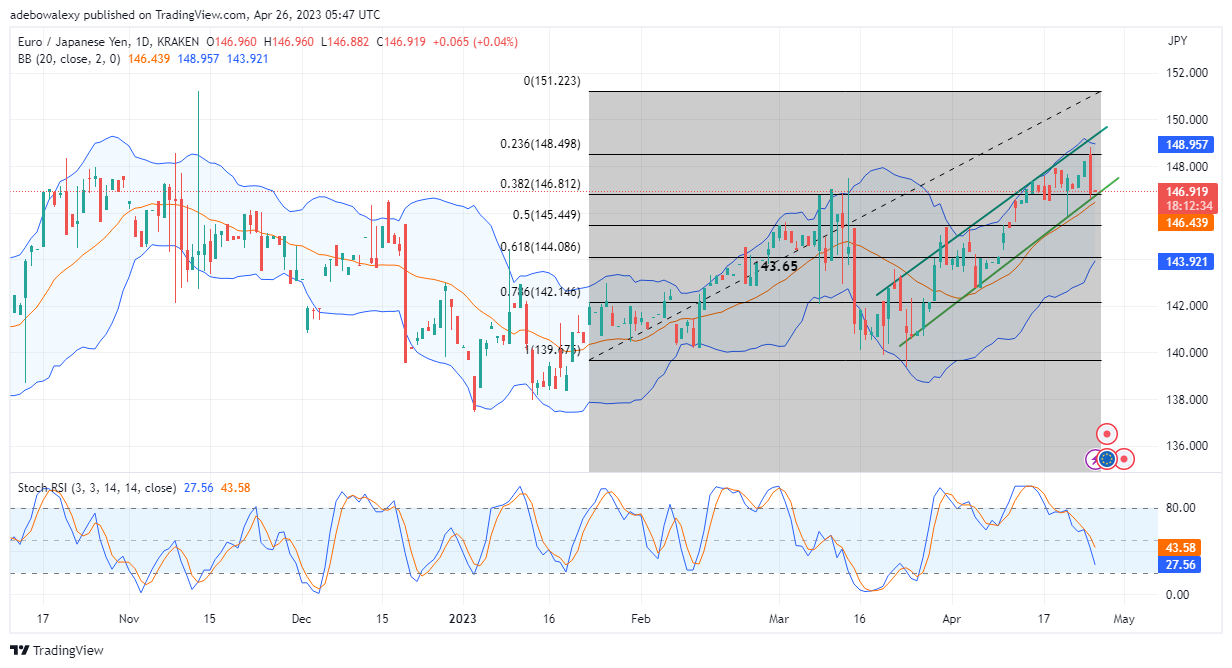
An unexpected downward retracement occurred in the EUR/JPY daily market as price action dropped instantaneously. This price fall cancelled out moderate gains from about four trading sessions ago. However, there are still indications that price action may recover from this downward retracement.
Major Price Levels:
Top Levels: 146.91, 147.20, 147.60
Floor Levels: 146.50, 146.10, 145.80

EUR/JPY Manages to Maintain Trading in an Upside Price Channel
Price action in the daily EUR/JPY market fell instantaneously to hit the 38.20 Fibonacci Retracement level as a support. However, this price level seems so strong that price action could not continue downwards. Subsequently, a dashed-shaped candle has appeared off this level. The Stochastic Relative Strength Index (RSI) is falling sharply toward the oversold region. Nevertheless, it should be noted that the current price of the pair remains above the middle band of the applied Bollinger Bands. So, this seems to hold the hope that price action may still recover in the upside direction.

EUR/JPY Price Action Seems to Have Started a Recovery Move
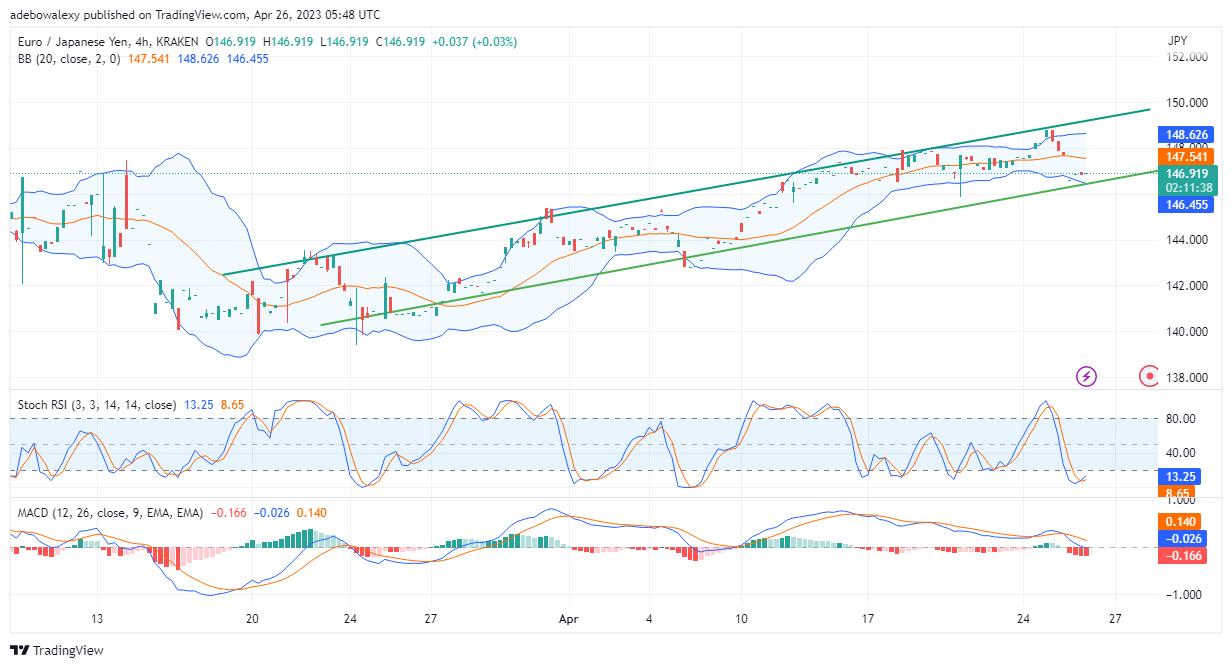
On the 4-hour EUR/JPY market, it appears that the upside recovery move has already begun. A dashed green price candle has appeared on the market chart. Furthermore, the lines of the RSI have crossed each other to indicate a gain in bullish momentum. The MACD indicator, however, hasn’t indicated a positive gain in upside momentum but remains above the equilibrium level. Therefore, buyers will have to step up their game if the market trend is effectively influenced and prices move further toward the 157.54 mark.
Do you want to take your trading to the next level? Join the best platform for that here.


Leave a Reply