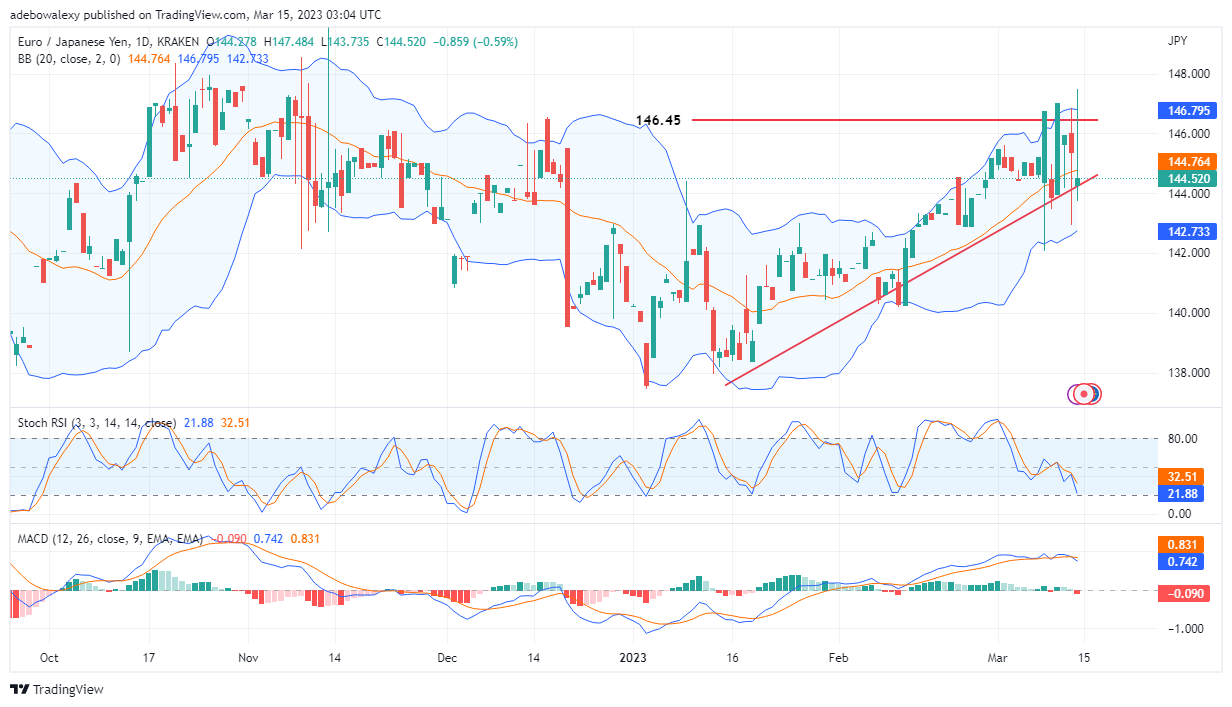
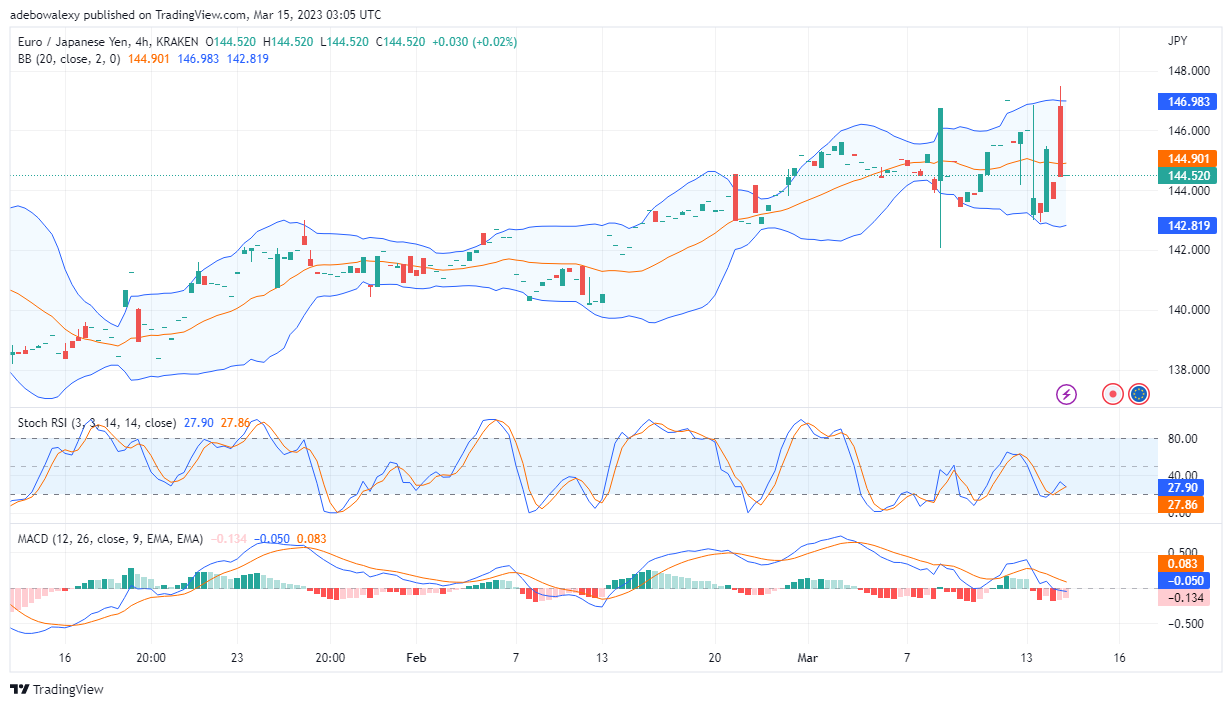
Price activity on the EUR/JPY is highly unstable at this point. Even at that, price activity still seems determined to reach the 146.45 mark. Nevertheless, traders must be cautious to avoid getting sliced in this extremely choppy market.
Major Price Levels:
Top Levels: 144.52, 145.00, and 146.00
Floor Levels: 144.00, 143.52, and 143.00

Bulls and Bears Battling Hard in the EUR/JPY Market
On the EUR/JPY daily market, it appears as if buyers and sellers are heavily contending for control of price action. However, the last price candle shows that the buyers are still taking the lead. Nevertheless, the long candle wick shows the struggle that has gone on between the buyers and sellers. Although buyers are still winning at this point, trading indicators are showing that prices may fall toward lower support levels. The curves of the RSI can be seen resuming their downward path after attempting a bullish crossover. Meanwhile, the lines of the MACD indicator seem to be moving slightly downward after a crossover above the equilibrium point. Consequently, it appears that this market possesses a bearish tone despite the fact that bulls are leading.

EUR/JPY Price Upside Move Hangs by a Thread
Looking at the EUR/JPY 4-hour chart, one can see that bearish price candles have recently outnumbered bullish ones. The last price candle on this chart is a dashed but green price candle, keeping the pair’s price at 144.52. However, the RSI indicator shows that buyers may be on the verge of losing their hold on price action. But contrary to this opinion, the MACD indicator is pointing out that bears are growing weary. This could be seen as the bars of this indicator are now pale and shorter in appearance. Therefore, traders will have to hope that buyers retain them long enough for sellers to get completely exhausted. Thereafter, price action may continue moving towards the 146.00 price mark.
Do you want to take your trading to the next level? Join the best platform for that here.


Leave a Reply