EUR/JPY Long-Term Analysis: Bearish
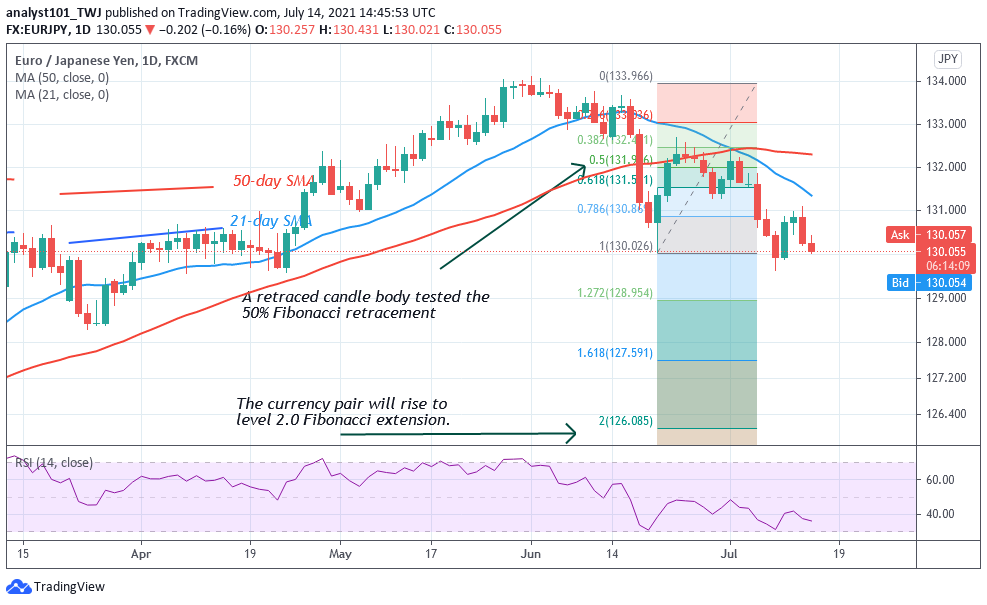
EUR/JPY is now in a downtrend. The currency pair faced rejection at level 134.00 and it retraced to level 133.00. After a retest at level 133.50, the market declined to level 130.00 and corrected upward. The selling pressure will persist as price breaks below the previous low. Meanwhile, on June 21 downtrend; a retraced candle body tested the 50% Fibonacci retracement. The retracement indicates that the pair will fall to level 2.0 Fibonacci extensions or level 125.97. From the price action, the pair has declined to level 130.06
EUR/JPY Indicator Analysis
EUR/JPY has fallen to level 36 of the Relative Strength Index period 14. It indicates that the pair is approaching the oversold region of the market. The 50-day SMA and 21-day SMA are sloping downward. The moving averages have bearish crossovers as the 21-day SMA crosses over the 50-day SMA. Nonetheless, the EUR/JPY pair has fallen below the 20% range of the daily stochastic. It indicates that the market is in the oversold region.

Technical indicators:
Major Resistance Levels – 133.00, 134.000, 135.000
Major Support Levels – 128.000, 127.000, 126.000
What Is the Next Direction for EUR/JPY?
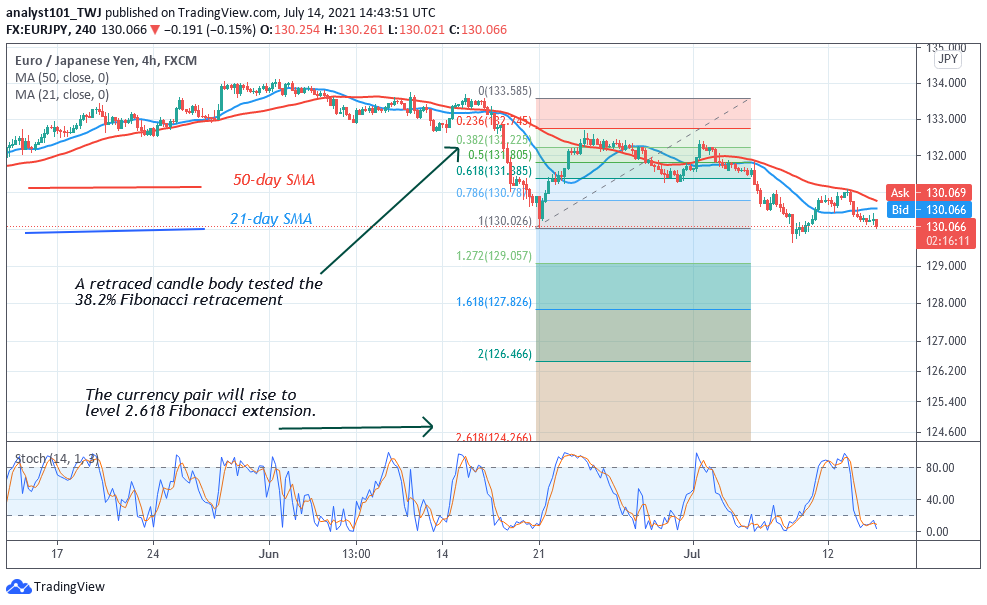
EUR/JPY pair is in a downward move. On the 4-hour chart, the pair makes upward correction but was rejected at level 132.00. This indicates a further downward movement of the pair. Meanwhile, on June 21 downtrend; a retraced candle body tested the 38.2% Fibonacci retracement level. The retracement indicates that EUR/JPY will fall at level 2.618 Fibonacci extensions or level 124.26.

Note: Forexschoolonline.com is not a financial advisor. Do your research before investing your funds in any financial asset or presented product or event. We are not responsible for your investing results


Leave a Reply