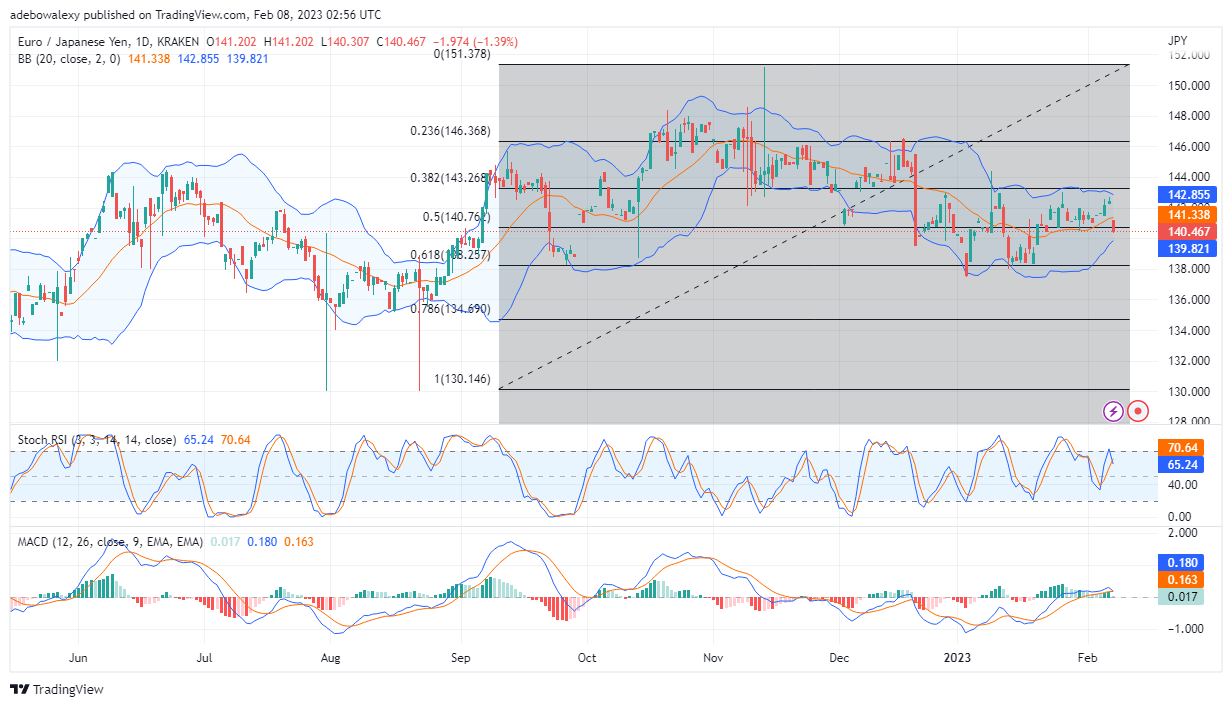
During the previous trading session, EUR/JPY price action was able to claim the 142.50 mark. But, shortly afterward, there was a spontaneous decrease in the pair’s upside strength, and this caused the pair to revisit the 140.00 support.
Major Price Levels:
Top Levels: 141.00, 142.00, 143.00
Floor Levels: 140.47, 139.00, 138.00

EUR/JPY Is Now Trading Below the 140.76 Support Level
In the ongoing session, price activity in the EUR/JPY on the daily market has fallen below an important support level. This important level, 140.76, aligns with the Fibonacci level 50. And at that, it appears as if price action may be ready to visit lower price marks. The Stochastic RSI has just performed a bearish crossover above the 60 levels of the indicator. Likewise, the applied MACD indicator lines have also approved a possible further price decline after it performed a bearish crossover. Even the price candle for this session formed below the middle band of the Bollinger band indicator. All of these indicators point to a possible decline in the EUR/JPY rate.

EUR/JPY Still too Weak to Resistance Headwind
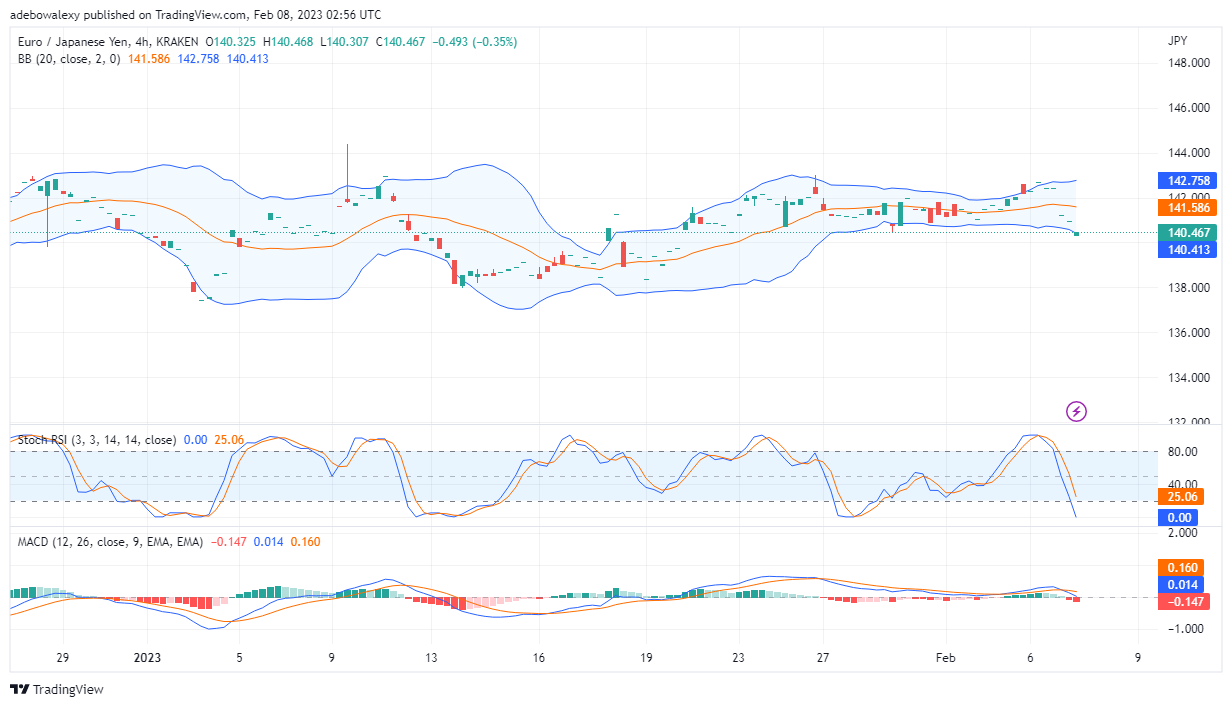
EUR/JPY Price action on the 4-hour market appears to be trying to fight back against downward forces. However, trading indicators reveal that market bulls may be too weak to efficiently resist a price fall in this market. A green price candle has just appeared off the lower limit of the Bollinger band indicator, which indicates the effort of the bulls in trying to resist the price decline. Contrary to this, the RSI lines keep falling into the oversold zone, while the MACD lines are now touching the 0.00 line of the indicator. Also, red bars can be observed appearing below the equilibrium level of the MACD. Consequently, these signs reveal that price action may lack the needed traction to retrace resistance. Their EUR/JPY price may visit the 138.00 price mark.
Do you want to take your trading to the next level? Join the best platform for that here.


Leave a Reply