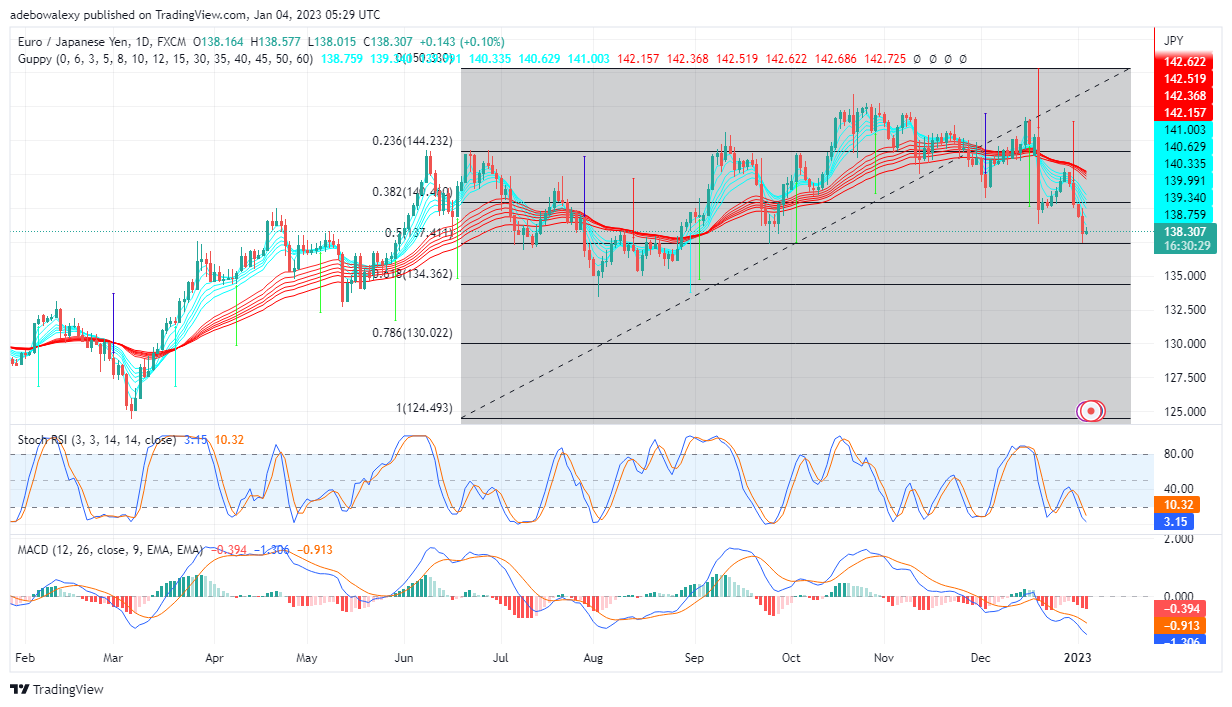
Ever since EUR/JPY price action lost its upside traction near the 145 price mark, around December 15 price activities quickly ripped through two Fibonacci support levels. Additionally, the upside retracement at the price level of 141.00 failed to reclaim the lost price mark of 144.00. Another retracement seems to have begun; let’s examine it to understand how this may go.
Important Price Marks:
Resistance: 138.32, 139.00, 140.00
Support: 137.00, 136.00, 135.00

EUR/JPY Could Retrace to Lower Levels
The EUR/JPY price has declined significantly from its over eight-month high at a price level of 145.00 to roughly 138.00. However, the experienced downside retracement appears to be continuing. The Stochastic RSI lines are running helplessly deeper into the oversold zone. At the same time, the MACD indicator lines have also continued to descend below the equilibrium level. Additionally, the histogram on the MACD indicator is now solid red. Consequently, this indicates that downside momentum may be strengthening. Therefore, it’s more likely that traders witness a further price decline in the EUR/JPY market.

EUR/JPY Minimal Recovery Appears Weak
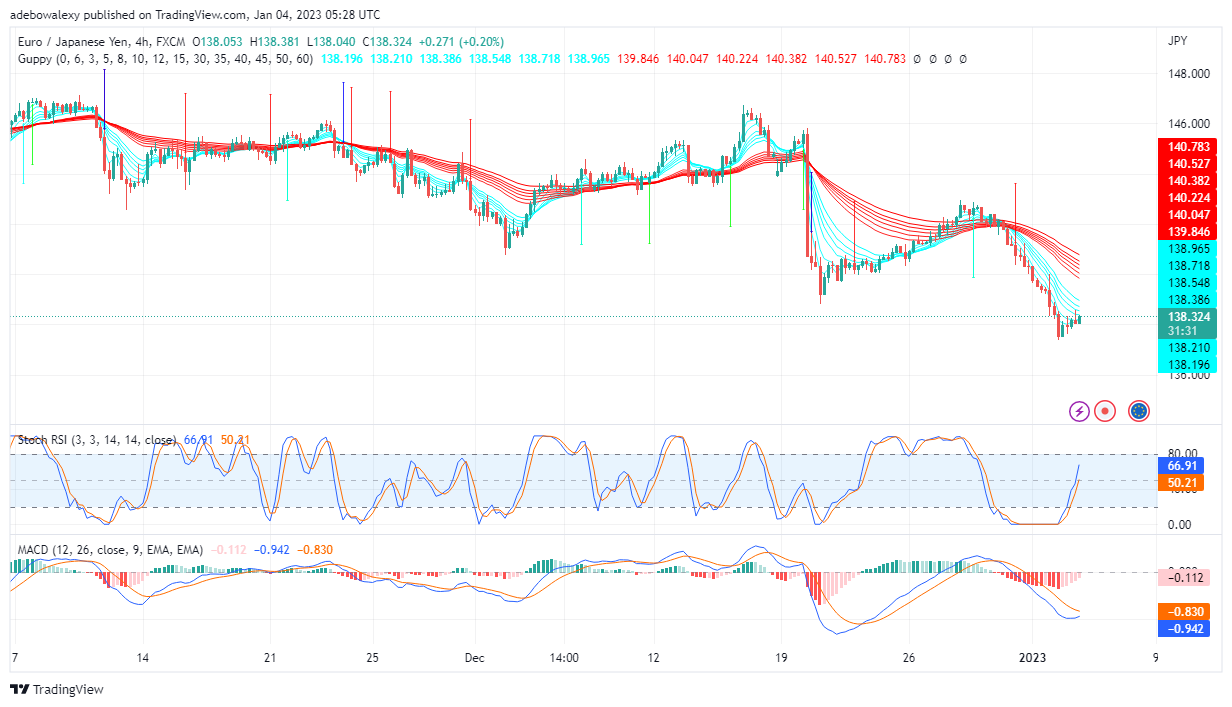
On the 4-hour market, the minimal recovery is more clearly expressed. Here, it could be seen that, as small as the upside recovery is, it appears as if traders are losing buying confidence. This could be observed as red-price candlesticks could be seen interrupting the minimal profits that were being gathered over the past four trading sessions. The lines of the RSI appear to be too sensitive, as it has quickly risen above the 50-level levels, even at such meager profits. However, the lines of the MACD indicator are now approaching each other for an upside crossover, which would indicate a gain in upside momentum. Nonetheless, based on the majority of the indicators, traders can expect the EUR/JPY market to continue falling toward the 135.00 level.
Do you want to take your trading to the next level? Join the best platform for that here.


Leave a Reply