For price action traders the emphasis for all high probability trades is looking for the best areas to play their trades from and building a strong price action story to back up their trade. For example; is the trade with the trend? Is the trade moving off a price flip area? Does price have space to move into? Is price rejecting an obvious Fibonacci level? Etc.
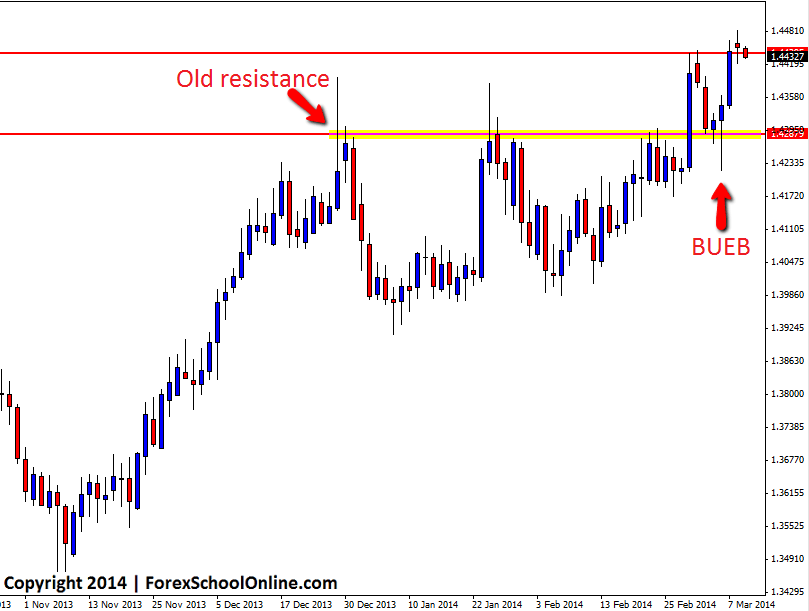
Price on the CHFSGD has recently moved higher after breaking through a key price flip level on the daily chart. This price flip area had acted as a key resistance and price had struggled to move through, but once price moved through, it sliced right through and made a substantial move higher. By this stage there was quite a strong move higher and with the resistance strongly being broken, the momentum was clearly higher. For price action traders these types of clues quickly start to build up into forming the price action story.
Price then retraced back lower into the old resistance and possible new price flip support area. I say possible because until price holds with bullish price action, the level has not held as support yet. This new support price flip is a high probability level for price action traders to look for long trades on both their daily and intraday time frames such as the 4hr and 8hr charts. As just discussed above; price has now broken a major resistance and closed above and price has all the momentum to the upside.
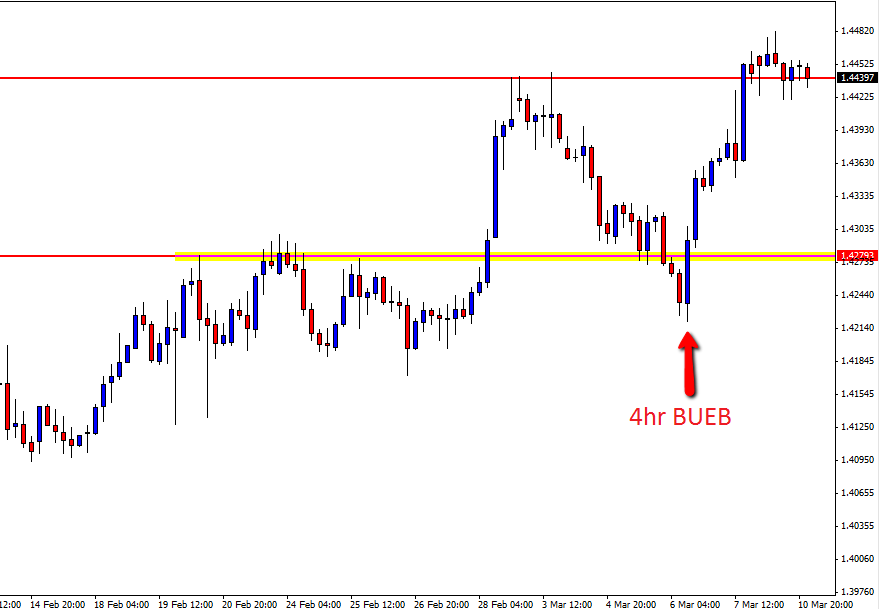
On both the daily and 4hr charts price fired off Bullish Engulfing Bars (BUEB) at this daily key support area. Whilst the daily BUEB had a long wick, the key was that price closed in the upper 1/3 of price showing that price closed strong and bullish at the end of the session. See the charts below:
CHFSGD Daily Chart

CHFSGD 4hr Chart


Leave a Reply