This is a pair that in recent times has been absolutely chock-full of price action clues and tip-offs, if you have the know-how to read them and know what they mean.
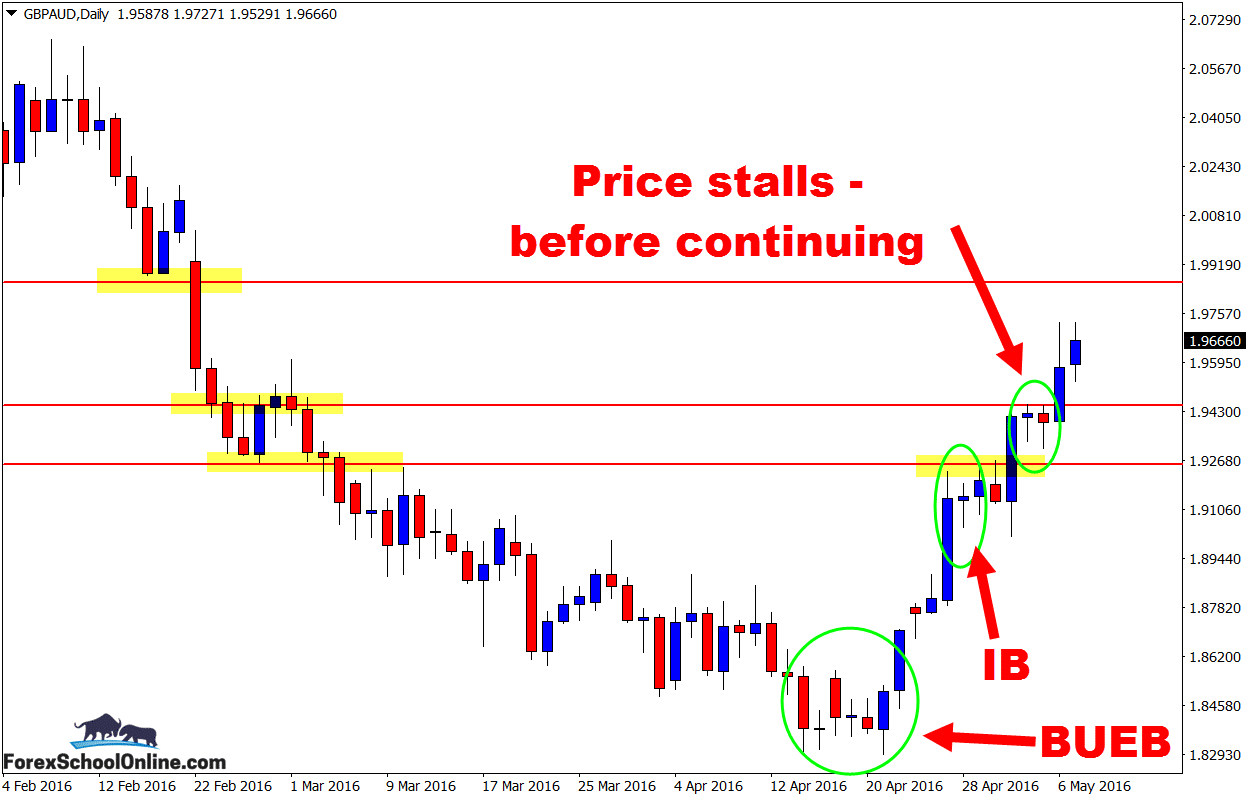
As you are about to read and find out, we have had Bullish Engulfing Bars (BUEBs), Inside Bar (IBs) and price reversing after forming a base down at the extreme low. Now what is price doing and where is it going? That’s what we are looking at.
It is rare for price to reverse and turnaround in one candle. After making a move or a rotation, trend etc., you will rarely find price just up and turn around and move against all of the trend or momentum in a single candle.
To reverse a trend it takes time and a build up of momentum. Think of it in price action order flow terms and think about price in a down-trend where the bear/sellers are in control. For this trend to turn around, the bulls/buyers have to reverse the momentum and turn the market into a position where they are in the majority.
Back to the price action: what normally happens and what you can see on the GBPAUD daily chart is that price often creates a ‘base’ to reverse. This is where price is building the order flow necessary to reverse. You will notice how price did not just reverse in one single candle, but it stalled and consolidated at the lows before then forming the Bullish Engulfing Bar to explode higher.
I discussed this setup in the 3 x Forex Pairs Sitting at Crucial Daily Levels | Daily Forex Commentary 26th April 2016
After breaking higher, price stalled and formed an inside bar just under the major resistance level. Inside bars are best traded with any strong momentum – if there is any – and in this case price continued strongly, forming ANOTHER Bullish Engulfing Bar.
Price moved once again higher before pausing and taking a breather like you can see on the chart below;
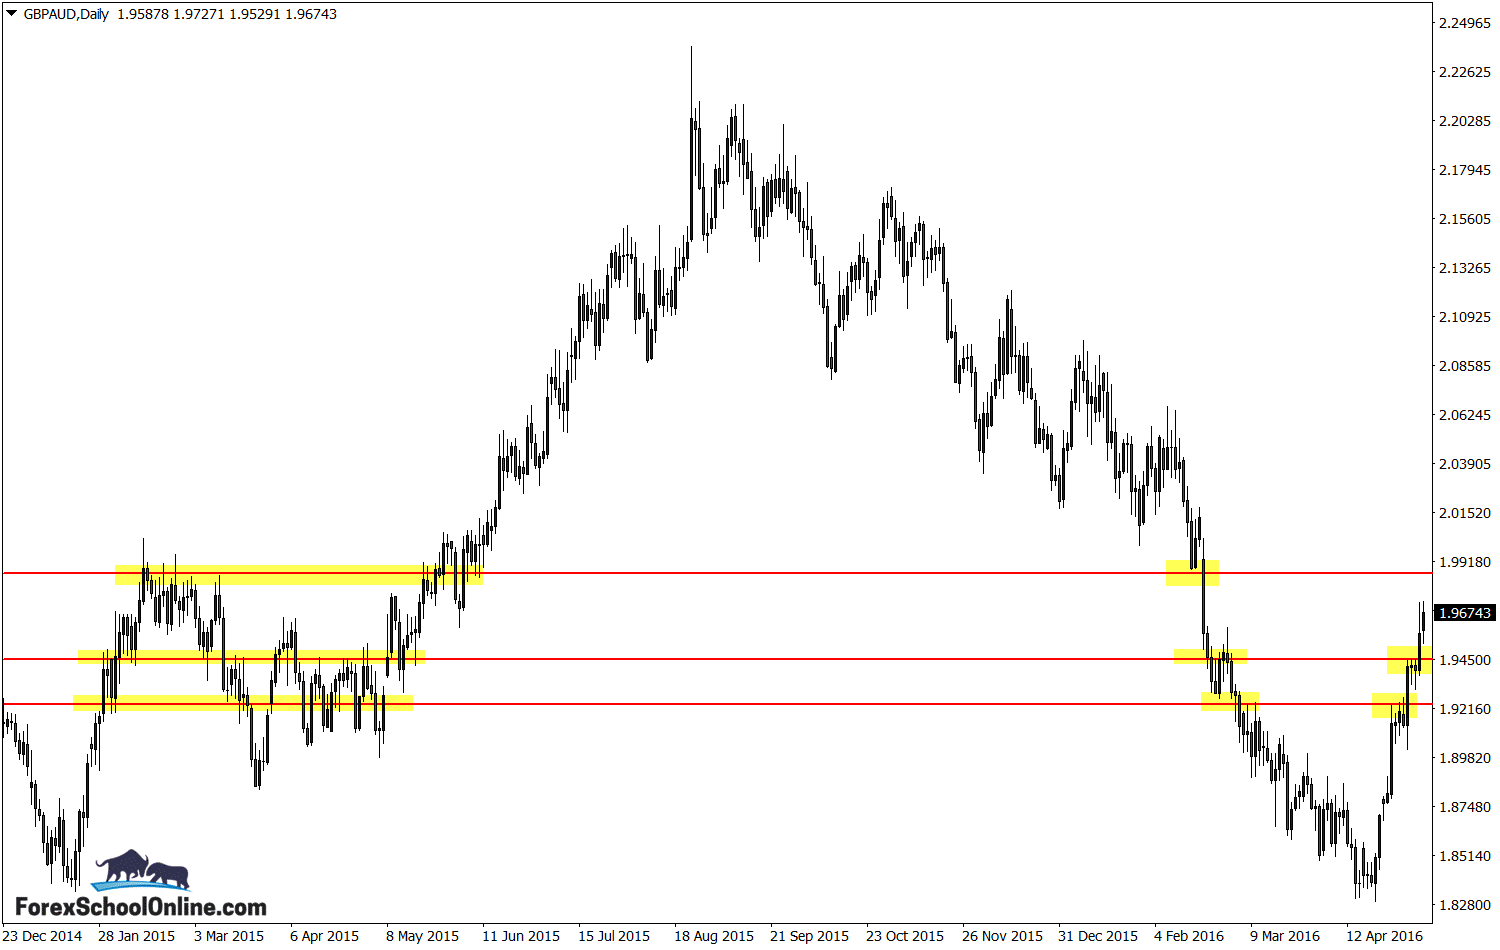
Price then broke higher and through the major daily resistance level and as I write this for you price is continuing to move higher. If price can continue to move higher with the strong momentum, the next major daily level comes in around the 1.9860 area.
There are two ways to play this market. Obviously looking and watching for any pull-backs into support will be high probability plays. If price does pull-back or make a rotation lower into the support level, we can watch it on both the daily and also our intraday charts to see if it holds as a price flip level, and to then look for a long price action trigger signal like I teach in the members’ courses. This would be trading at a major daily level and with the strong recent momentum.
The other play is to look for a more advanced and aggressive trade setup in hunting short trades at the resistance overhead. This would be counter-trend and only for advanced traders, but this is a major daily price flip level. It would offer a lot of potential space for price to move back into, it would also have a clear path for traders to manage their trade and a high risk reward potential to off-set the risk involved.
Daily GBPAUD Chart
Daily GBPAUD Chart

Related Forex Trading Education


Leave a Reply