How to Draw Support and Resistance With the Price Action Story
Traders are so often wrapped up in looking for the best price action signal and the one candlestick pattern that is going to bring them their riches that they fail to realise the key to price action trading; Support and Resistance.
If a price action trader can’t identify key levels of support and resistance on a chart, then everything else they do is going to be a waste of time.
A lot of price action educators are teaching their students how to only spot the very best price action entry candle.
What I mean by this is; trading mentors are teaching their students how to identify the last candle on the chart, but not the rest of the price action story. An example of an entry candle is a Pin Bar reversal.
A Pin Bar reversal can be a very powerful price action signal, but only when placed into the right price action story. When the Pin Bar is placed into the wrong story it can be a disaster and this is where support and resistance comes in.
Reading The Price Action Story
How you draw your support and resistance levels will make the price action story. Every chart we look at is telling us a story and it is our jobs as traders to learn what it is telling us. We can learn many things from a chart such as:

- Are there any support or resistance zones?
- Is price struggling to break any key areas?
- Is price making fresh highs or lows?
- Is price retracing to an area or interest?
- Is price making a reversal signal?
- Is price making a continuation signal?
- Is price stuck in a range or a box?
- Has price just broken out of a range or boxing area and could now explode higher or lower?
The price action story is the most important part of any trade. The entry candle is only the last candle and only the confirmation candle for entry for any trade. If traders are to enter a trade without any knowledge of what the price action story is, they are severely hindering their chances of a winning trade.
For example; a Pin Bar rejecting a key resistance level that is with the trend and that has space to trade into has a lot higher chance of being a winning trade than another Pin Bar that the trader does not have a clue what the price action story is.
Baking a Cake | Making Winning Trades
Much like baking a cake, making winning trades is about adding in more and more and layers and mixing it all together. If you are making a cake and you only put one ingredient into the cake and mix it together your cake it going to be pretty bland tasting cake.
It is exactly the same with trading price action signals and working with the price action story. You need to add the layers and mix as many quality ingredients as you can to make the best product.
If you are only going to trade one entry candle by itself, then your chances of having a winning trade by itself are not going to be great. If on the other hand you trade that entry candle  with other layers such as within a strong trend, at a key support or resistance level, at a key swing point and a critical Fibonacci level then with the added layers of confluence your trade is going to have a much better price action story and a much high probability of being a winning trade.
Important Note: Support and Resistance are NOT perfect straight lines. They are levels, areas or zones
The most important part of any chart, in any market is the horizontal support and resistance levels. The support and resistance levels that price action traders take their trades from are FAR more important than signals that they use to enter the trades. This is something that can take traders a long time to get their heads around, but it is very important they do.
The entry signal that traders use to enter the market is only the last one candle. The support or resistance level is many candles that have been proven by the market in most cases many times previously. The reason it is so crucial that traders trade from key support and resistance areas is because they are trading with the rest of the market.
How Do You Draw Support and Resistance in Correct Order?
When trading from a key support or resistance level a trader can be trading on the right side of the market with the full force of the market behind them if they have picked the right level, and this is why it is crucial before ever looking for any price action signals the trader’s first scopes for their key levels.
Many traders however, go about this back the front i.e.; they look for price action entry signals and then look for their support and resistance levels, but this tends to create mind tricks.
When going about it this way what tends to happen is the trader will find an entry signal for example an engulfing bar and then the mind will start to play tricks such as; it will find support/resistance where there is none to get the trader into the trade, it will convince the trader the trend is in their favour even though it clearly is not or it will find other odd reasons and excuses to get into the trade such as a random Fibonacci levels like 69.99% for example…
The best way to avoid this and to also keep trading simple is to identify the key levels first. After you have your daily charts set up, go through them and identify your key support and resistance levels. Below I will quickly cover the simple routine with how you should do this in a basic tutorial.
Marking Support and Resistance Tutorial
Like everything in trading the best way to mark support and resistance is to keep it simple. There are so many ways to do everything in Forex and there are also so many people wanting to tell you how to do it. In my trading the longer I go the more I realise simpler really is best.
Daily Charts
All of my charts are setup on a daily chart and my chart analysis is now run on a MT5 platform. The reason I run things this way is so I can easily switch from a daily chart straight down to a 4hr/8hr/12hr chart or any other time frame and keep all my support and resistance lines. This is not available with MT4. Whilst with MT4 I can bring up any time frame I like, I have to bring up a new separate chart and lose all my levels, whilst with MT5 I can just seamlessly flick through any time frame I like keeping the same levels. Why I need this will be explained below.

On a Sunday evening I go through my charts and mark my support and resistance levels on my daily charts. I watch around 40 or so pairs. This includes Forex and indices. The levels I mark include any levels I may be looking for price to move back to for any trading opportunities or any breakouts I may be looking to trade etc.
Two Levels Only
I only mark two support and resistance levels on any one chart. I can never understand the charts that you see on the internet with 20 support and resistance lines all over them going everywhere. The basic rule is; I have one line above price and one below and if price breaks through one of them, then I reassess and mark the new level. There is simply no need to mess up a whole chart with a bunch of rubbish and hide the most important part of the chart; the PRICE ACTION.
Trading Intra-day Signals from Daily Marked Levels
This is a key rule and will stop a lot of traders from getting into trouble with their trade entries. The smaller the time frame the trader moves down to, the more support and resistance levels they are going to start seeing and also the less important the support and resistance levels are going to become.
This is why marking support and resistance levels on the daily chart and then using these levels to trade from on all time frames can help traders to always trade from great areas on the charts.
Instead of moving down to the 4hr chart and looking for support and resistance levels to trade from, traders are much better off going to their daily chart and first identifying their key levels and then moving down to their intraday chart to spot price action signals at the key daily level.
Doing it this way ensures that the trader is still getting into trades at key daily support and resistance levels and not in the middle on no-man’s land on the intraday charts which can be dangerous for intraday trades especially.
Example Charts
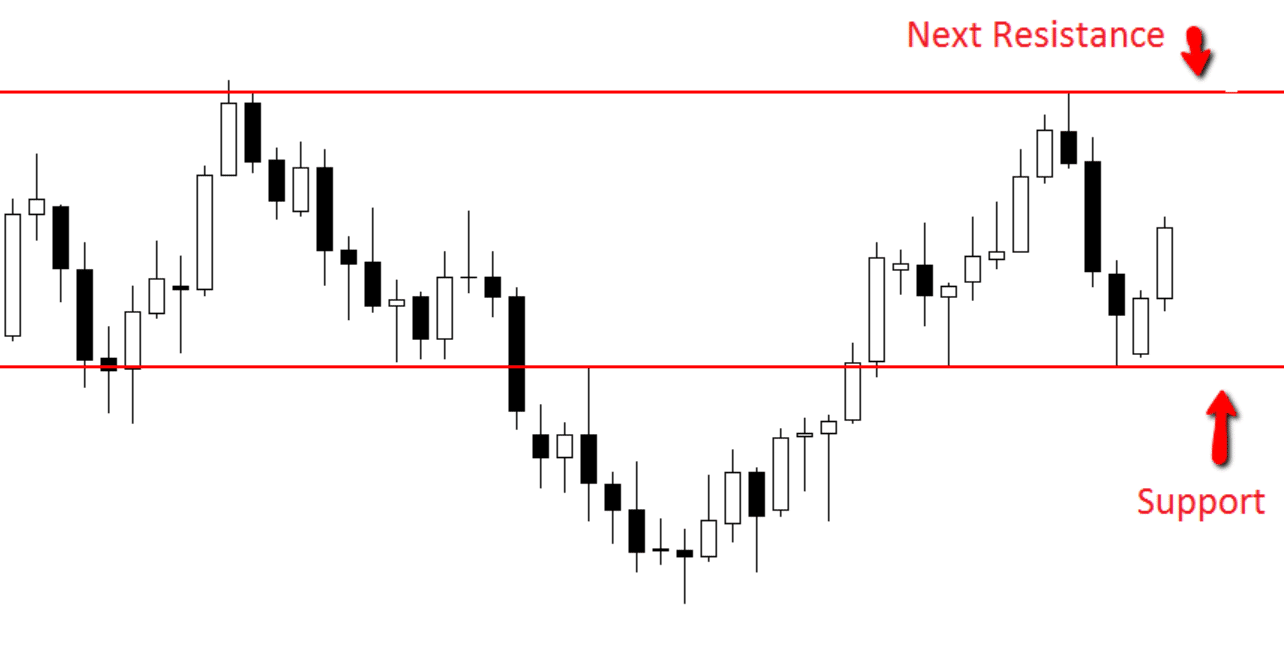
Below is a daily chart with two levels marked. You will notice one level is above and the other below price. These levels are the two most obvious support and resistance levels in this market that price will have to move through to either move higher or lower.
These are both key support and resistance areas. Having marked these key levels on the daily chart I can now move to the 4hr or any intraday chart and have confidence to trade knowing that I will be trading from key levels as long as I trade from these same key daily levels.

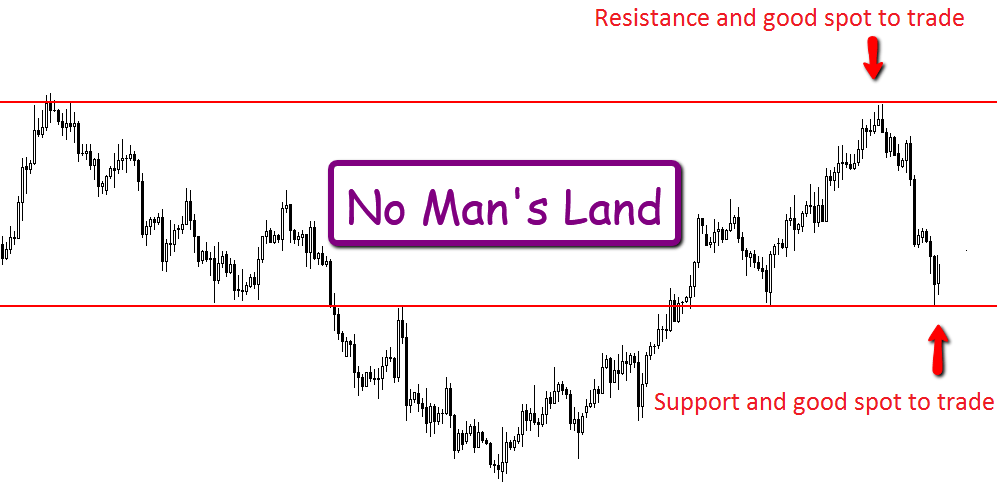
The example chart below is the same pair as above with the same levels , but now on the 4hr time frame. This chart highlights the key levels and shows that they are even more respected on the lower time frame chart.
A key reason for trading this way and trading intraday signals from daily marked levels is to keep traders out of no mans land. What this means is; not getting into trades from swing highs and not at swing lows, but in the middle.
This is stopped when trading from key daily levels. You will see on the 4hr chart below the major support and resistance levels are both at the high and the low and they are not in between or not in the no mans lands. Traders who are not trading this way run the risk to flicking to their 4hr chart and trading from any support or resistance level and can get caught out in this middle area that is the danger zone.

This same process can be used to trade on any intra-day time frame whether it is trading on the 8hr, 6hr, 4hr, 2hr, 1hr or even lower time frames
If you are looking for more information on support and resistance there is another lesson that can be found here: How to Mark Support and Resistance.
You can also watch a video that goes into depth about the price action story here: Learn About the Price Action Story
I hope you are learning through these articles and videos and starting to put it all together in your own trading.
Safe trading and all the success,
Johnathon
If you have any questions or comments, just post them in the section below.


Hi Johnathon,
Can you recommend best brokers?
Rgds
Akshel
Hi Kumudu,
checkout the post at; https://www.forexschoolonline.com//recommended-forex-broker-charts/
Any questions let us know.
Johnathon
Great teaching Janathan. I have always wanted something that would clear the confusion. I have found it here. I hope to learn in depth how to trade like a pro.
Great to have you Chen.
All the success,
Johnathon
Hi SIr,
I really do hope I can learn how to spot the key level from Sir, I had tried for more than a years for SNR even tough I had been loss trade for 4 years.
Thank You
Great information and appreciate all the teachings you offer. I am back again and I am determined to learn how to trade the correct way forex. thanks.
Hi John,
nice to hear from you.
Let me know if you need anything.
Johnathon
awesome! unfolded the puzzle in the most simple manner.
That’s great! Let me know if you get any questions or need anything!
Johnathon
Price Action is the best tool for Traders as well as support n resistance area.
Hi Johnathan,
Thank you so much for the article regarding trading from key levels.However I have a question.When I draw the daily key levels and trade from the 4 or 1 hour chart, is my target profit taking level the next support that is if I took the trade from the resistance level?And does is add more wait if I trade only in the direction of the daily chart avoiding counter trends.Please advice.
Thank you.
Regards,
Jacqueline
Hello Jacqueline,
when you place a trade you should be managing that trade and looking for the profit targets on the time frame of that same time frame. All the trade management should be done on the same time frame you are making the trade. If you make a 1hr trade, then you should be working out the stops and all targets using the 1hr levels and never going to lower time frames and I explain this in-depth here: https://www.forexschoolonline.com//manage-forex-trades-using-key-price-action-time-frames/
Every chart has it’s own trend. Whilst we are using the daily chart levels, as I said above; every chart is individual and has it own invidual trends and you can read about that more here: https://www.forexschoolonline.com//how-to-trend-trade-price-action-in-depth-tutorial/
Safe trading,
Johnathon
Thanks JF.
hi john your articles is very good my problem is that i do not English
HAPPY NEW YEAR
Thank you
Hi Jonathan,
I understand the importance of trading from the key resistance and support levels on the daily chart, but the thing that confuses me is, let’s say that have missed to trade a valid pin bar from the resistance level on the daily,can I enter on a retracement on the 4 hour chart which does not happen on the daily resistance level? Also,will my target level be the major daily support or the next support level on the four hour chart having said we should manage our trades on the chart that we enter the trade?
🙂 Thanks
Can you recommend a Trader(s) with MT5 and a NY Close.
Thanks.
SCHOOL ONLINE TRADING COURSE.
thank you for the article Johnathon!
How I wish I had known about this 3 years ago!
Still time to make up for lost time eh!
Thank you so much Johnathon for the brilliant lesson.
Brilliant lesson. Thank you J.F.
Hey very nice blog!! Man .. Beautiful .. Wonderful .
. I will bookmark your blog.
I’m happy to seek out so many useful information here in the put up, we need develop more strategies in this regard, thank you for sharing. . . . . .
beautiful work.
Doctor Fox
Keeping thing simple using 2 key area levels, i enjoyed all your article
thanks doc
دردشه
This article really spoke to me and I felt you were writing it to me. This routine and only using two levels is exactly what I need. Thanks Johnathon.
Noble
Starting to really put it all together and turn the corner thanks to you. I have been a members for two months now and can not thank you enough. I am so lucky I found you. I just wish I found you earlier!
Jane
Super article Johnathon. Please keep them coming!!!