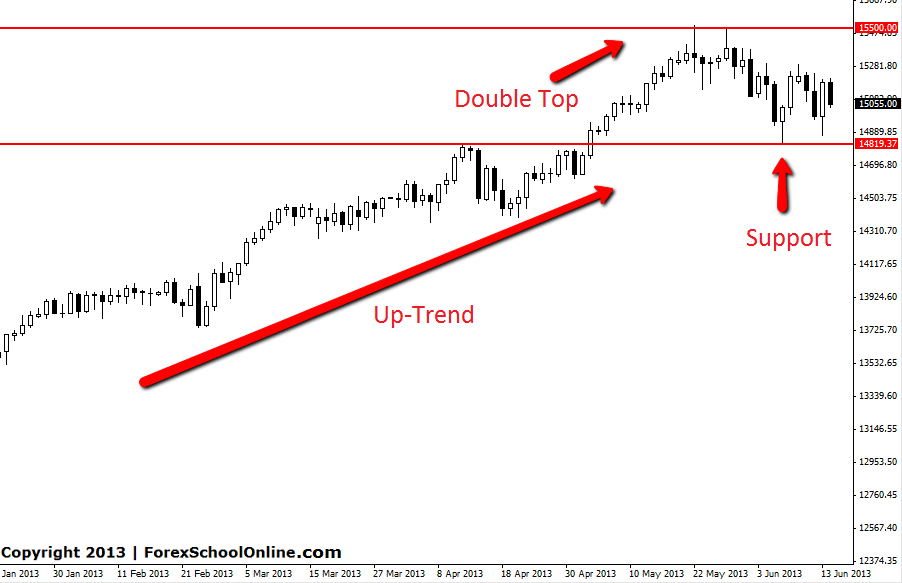
The Dow Jones has been in an extended up-trend for all of 2013 with the bulls firmly in control making higher highs and lows. Every attempt at pushing the price lower by the bears has only seen the bulls come in stronger than ever and push price onto new highs.
Recently price moved into big the round number and the resistance level on the daily chart of 15,500 that produced a Pin Bar. Price once again tested this level, forming a double top and a bearish rejection candle, before moving lower. This move lower was the first major retracement for trend traders to get into the market with this roaring up-trend from an area or value. Price moved back into support where trend traders could have got into a high probability trade.
At Forex School Online we teach our members how to place high probability trades and one of our principles that we teach is trend trading. We also teach counter trend trading, but trading with the trend can provide one of the best edges in the market.
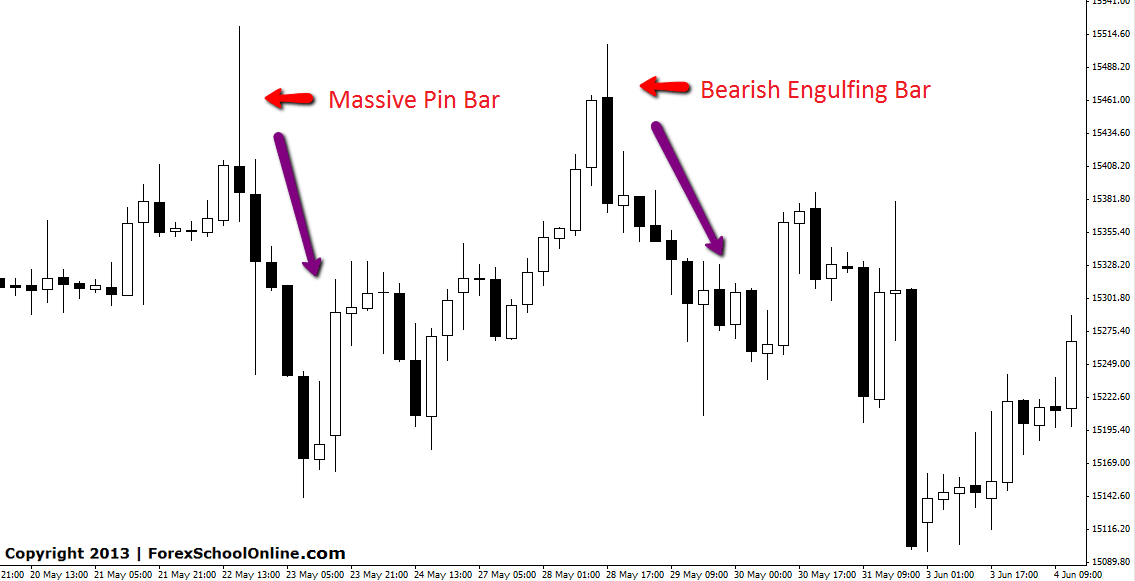
Price is now in between the major support and the big round number resistance double top area. The double top resistance area provided two very solid intra-day trading opportunities for price action traders. The first was a massive Pin Bar Reversal and the other was a Bearish Engulfing Bar. These two signals were the double top candles on the daily chart. Both signals were text book large, obvious signals that stuck out like a saw thumb and were instantly recognisable as soon as you flicked over to the chart.
DOW JONES DAILY CHART | 17 JUNE 2013

DOW JONES 4HR CHART | 17 JUNE 2013


Leave a Reply