How to Trade the Double Top and Double Bottom Chart Pattern
The double top and double bottom can be a simple pattern to identify, but incredibly powerful when traded correctly.
As the name implies, the double top is a pattern where two tops form, and a double bottom is where two bottoms form.
Whilst this pattern is pretty easy to recognize once you learn it, there are different strategies you can employ to trade it and find better reward trades.
In this lesson we will look at exactly how to find the double top and double bottom and how you can use it to find trades.
Anatomy of a Double Top
The double top and double bottom are a reversal pattern.
When we are using these price action patterns we are looking to trade either back lower with the double top, or back higher with the double bottom.
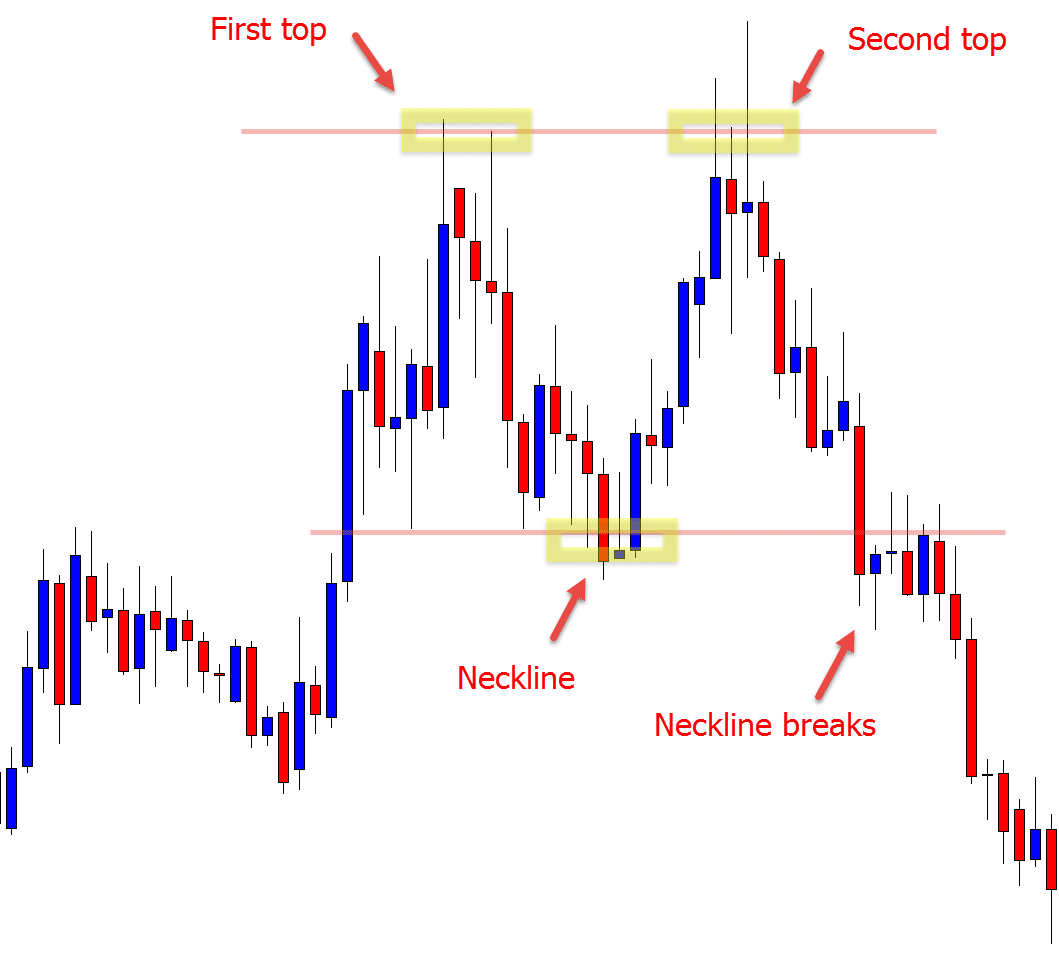
The double top has four main characteristics;
- The first top and rejection
- The swing lower known as the neckline
- The second top (double top) and second rejection
- Confirmation with a break of the neckline

As the chart example shows above; price makes a move higher and then rejects the first swing high. This is the first top. Price then rolls lower and finds support creating the neckline. When price moves higher and rejects the same top a second time we have the makings of a ‘double top’.
Many traders will wait for price to break the neckline for confirmation that the double top or bottom has in fact commenced.
This is not wrong, but as we discuss in just a moment you don’t have to and you can enter more aggressive trades using this pattern.
Anatomy of a Double Bottom
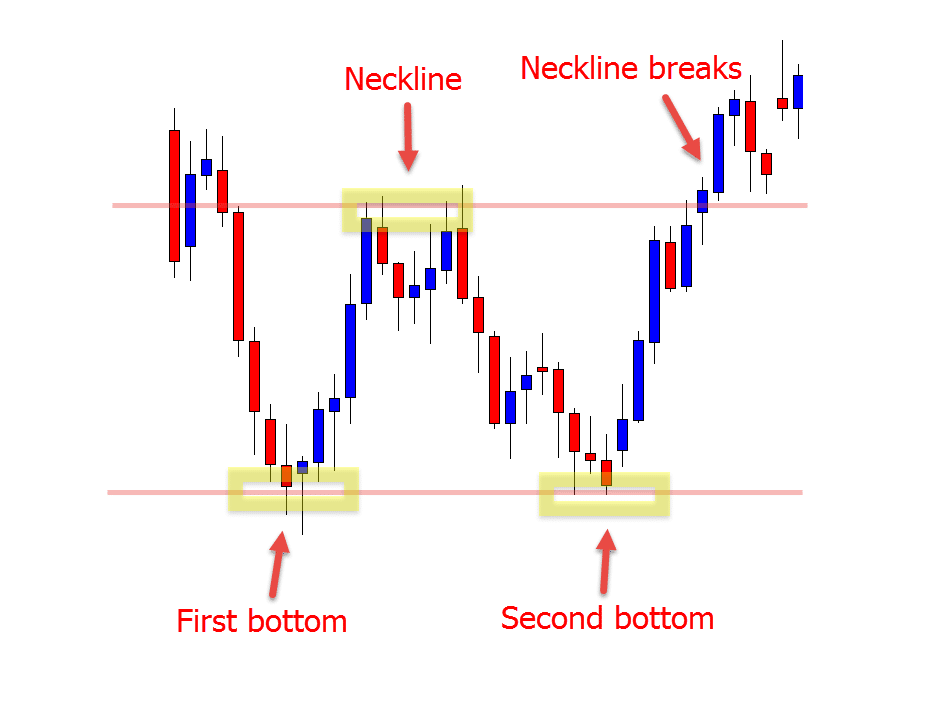
The double bottom has the same four key characteristics as the double top, only instead of looking for price to reverse lower we are looking for a reversal back higher.
The double top has two rejections of resistance and the double bottom has two rejections of support. See an example below;

In this chart you can see that price makes a move lower to reject the swing low (first bottom). Price then pops higher creating the neckline. When price rejects the same support a second time, the double bottom is created.
Three Strategies to Trade Double Tops and Double Bottoms
As with all things price action trading there are different strategies you can deploy depending on your individual style and comfort level.
With the double top and double bottom there are more aggressive strategies that you can use compared to others.
Aggressive Trading Strategy: Entering at Second Test
Whilst a lot of traders will wait for the neckline to break for their confirmation, you don’t have to.
If waiting for confirmation that the neckline has broken you will often miss the biggest move that first occurs.
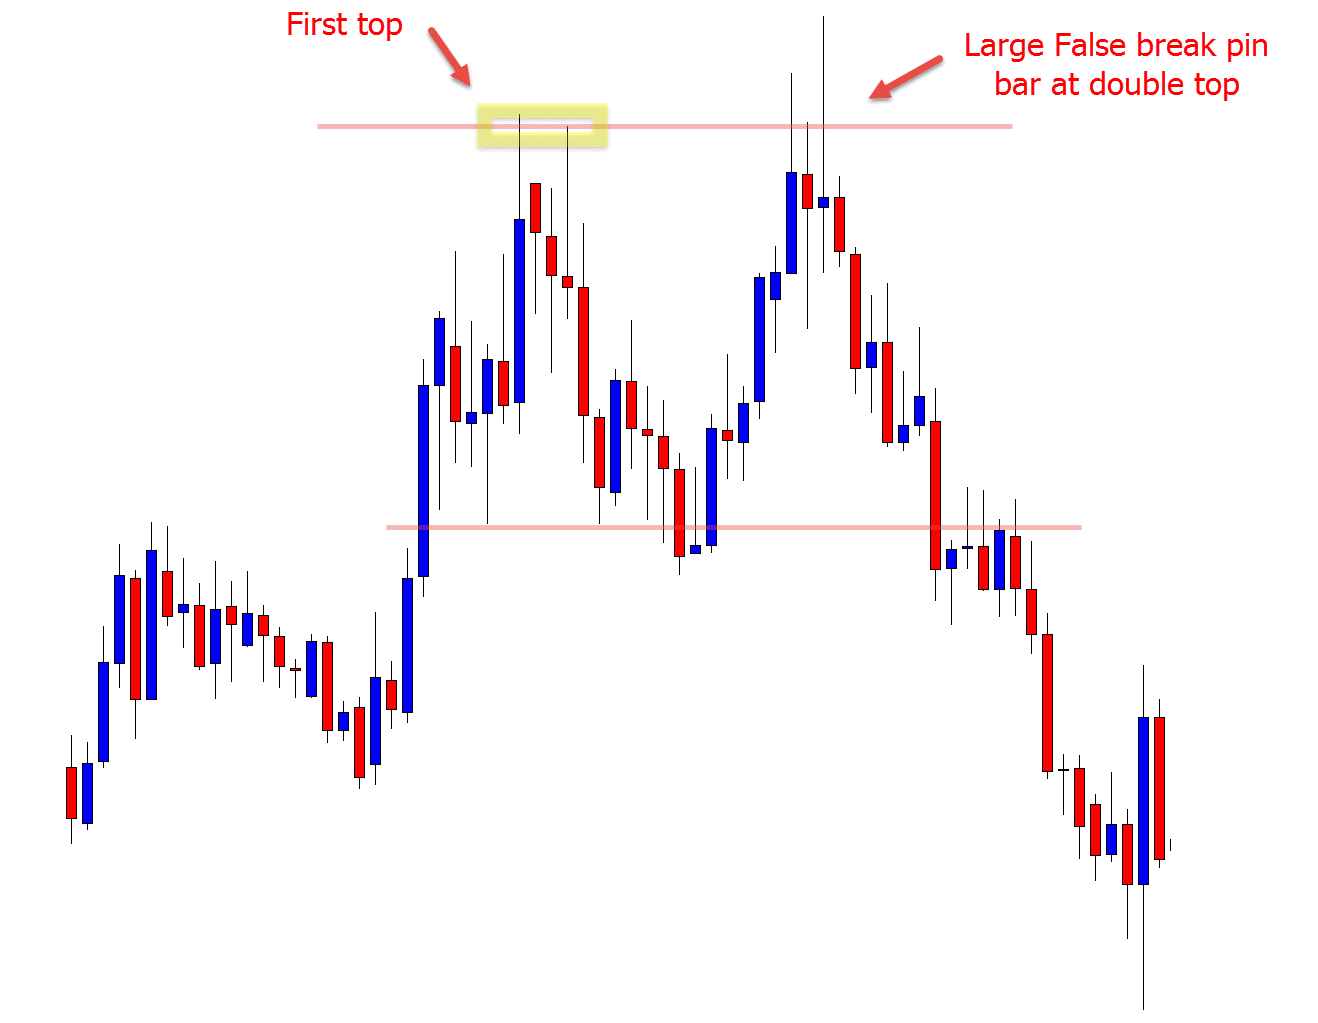
If you are an aggressive trader you can enter a double top or bottom as you begin to see it form.
You can read the price action and use high probability price action entry triggers to confirm that price is going to form a double top or bottom.
An example of this would be price moving up to the second test and forming a false break pin bar or a large engulfing bar.
See the chart below for an example;

At times you will miss the first move and not get a chance to make an entry. That is when identifying the pattern and using the other strategies discussed below can come in handy.
Waiting for the Neckline to Break
This is far less aggressive than entering straight from the double top or double bottom.
With this strategy you are looking to make a breakout trade when the neckline breaks out and confirms the pattern.
Identifying the neckline correctly can be used for entry, but you can also use it for your trade management.
If taking the aggressive trade entry discussed above, you could either set targets at the neckline, or look for a neckline break for bigger profits.
If price does break through you could then trail your stop above / below the neckline to lock in profits and let your trade run into a bigger potential winning trade.
Break and Retest of Neckline
This strategy is similar to watching your major support and resistance levels when they break and seeing if they hold as new support or resistance price flips.
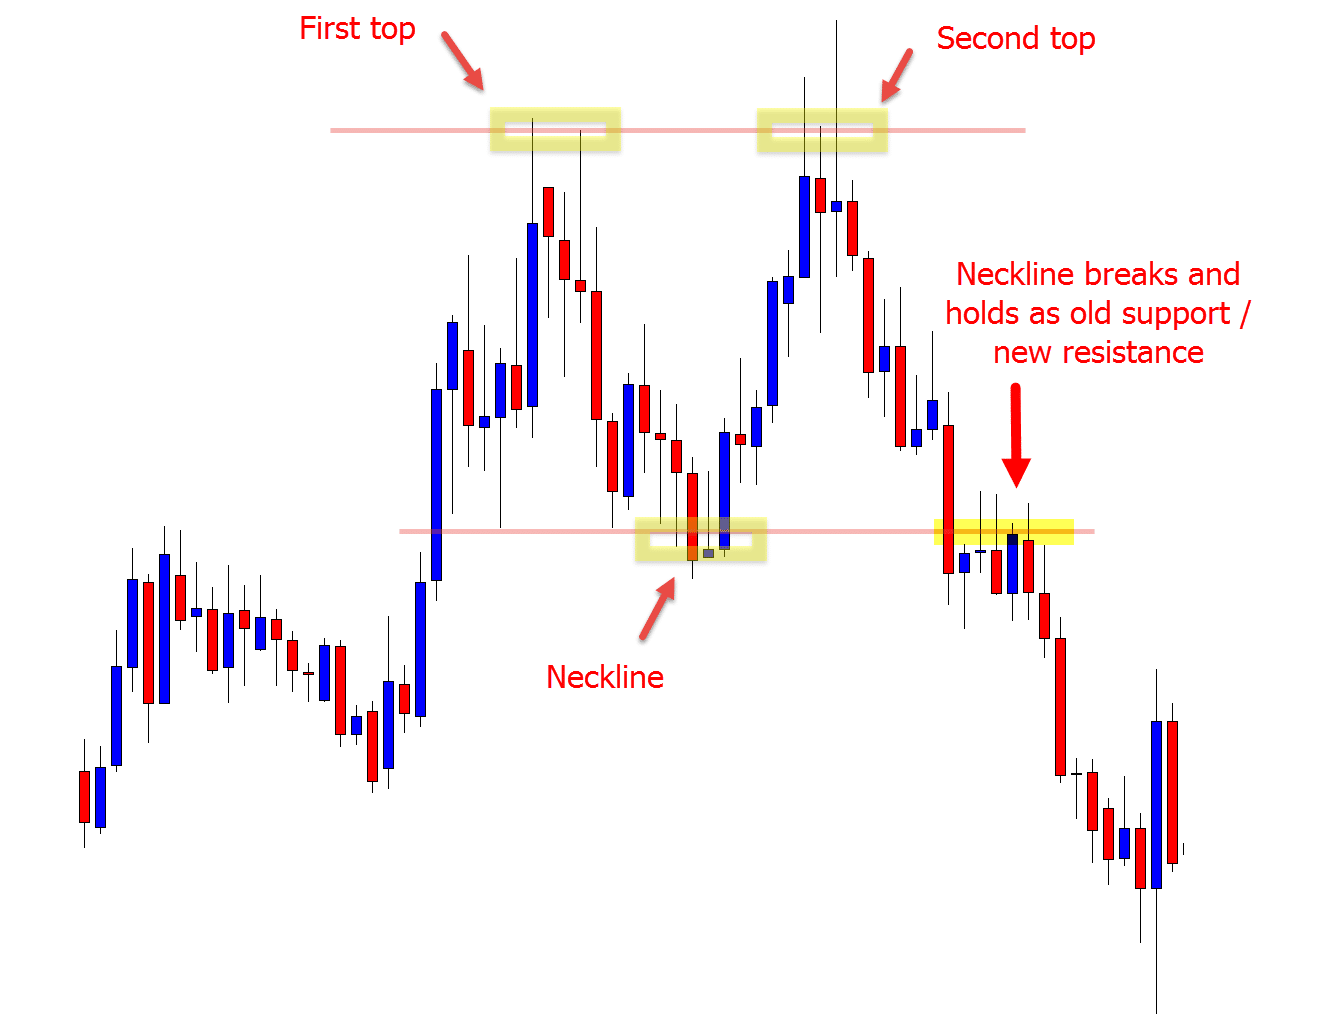
When the neckline has broken and confirmed the double top or double bottom, you can watch the old neckline support or resistance.
This level will often hold as an old support / resistance price flip level.
An example of this is below;

In the chart above price forms a double top and then confirms by breaking lower and through the neckline.
Price then quickly snaps back higher, testing the old neckline support which acts as a new price flip resistance.
You could hunt trades here the same way you normally would either on the daily or intraday time frames.
An example would be watching when price moves back into this resistance at the neckline price flip and then checking smaller time frames for bearish price action to get short.
Lastly
The double top and double bottom is another pattern you can add to your price action trading armory.
Like all patterns you should practice the heck out of it and make sure you use the strategy that is inline with your trading personality. Don’t use the more aggressive approach if you are suited to wanting confirmation.
I recommend using the double top and double bottom patterns with your other trading strategies. Whilst it can be a great method to spotting market reversals, it is just one pattern.
You can use many other strategies such as adding price action triggers, identifying the trend, watching the recent momentum and using the overall price action story to help increase your odds of making winning trades.
Safe trading,
Johnathon
Please leave your comments and questions in comments section below;


👍👍
Great article Johnathan, thanks for sharing
Recently reading/studying the beginners course; its very clear and comprehensive; the articles you include and suggest in order to explain topics mentioned through, are very helpfull. So far Thank you !!
Thanks 👍👍 Glad it helps. Let us know if you need anything else.
Johnathon
Excellent piece! But in the case of the large pin bar at the double top, where could possibly be the stop loss if one was to enter the trade at the break of the pin bar nose as you suggested in a previous article? Or can one use the 50% entry trick to have a good risk/reward?
Many thanks for your resolve to help struggling traders like me.
NB: One more thing sir, you promised to give a free Advanced Price Action Course on those who won on the survey you conducted. I’m pretty sure I am one of the winners and I claim it by faith. So please sir, use your magnanimity to consider me. Thanks a million.
Hi Paul,
I don’t personally use 50%, but not to say it cannot work. How you set your stop is up to you. You could use high/lows or surrounding price action, ie; key levels to help you find logical areas.
The survey and competition winners were announced and enrolled in their courses a little while ago now. We had many participants and unfortunately you were not a winner.
Safe trading,
Johnathon
You truly the one in trading. Your all trade example and discussion on different price action patterns are awesome. Thanks god that I found you somehow to lean the basic more accurately.
Thank you very much.
Thanks Rehan! It’s good to have you with us.
Johnathon
Thanks for information.My trading skill improve.
Great to have you Aaron 👍
Thank you sir, Your instruction is always right.
Thanks Firoz.
All the success,
Johnathon
Thanks for the information. Quite understandable.You have amazing ability to simplify things.
Thanks for comment Olatunde!
Safe trading,
Johnathon