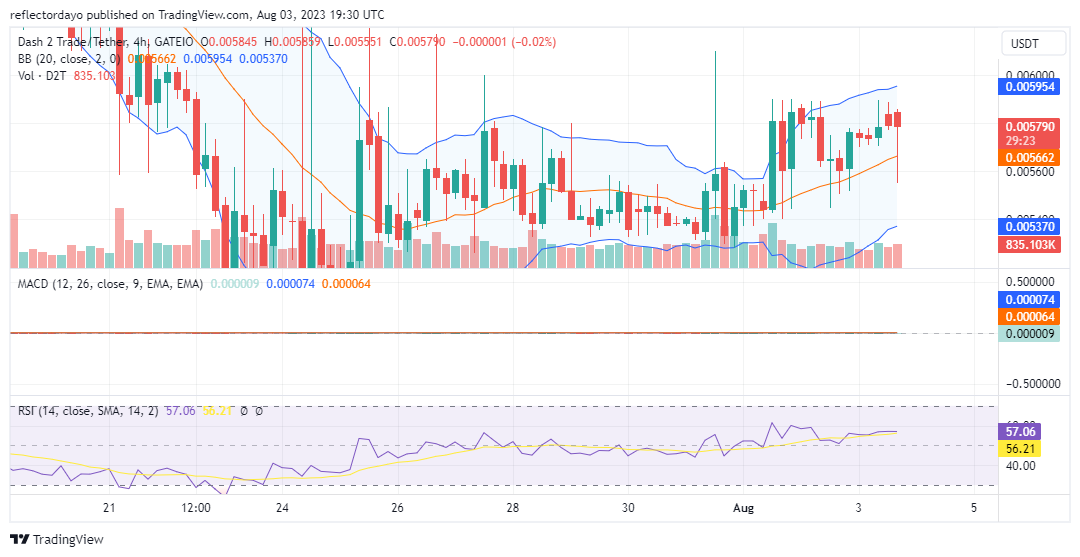
After finding their footing at the $0.0053 price level, the bulls made steady progress in the upward direction. However, a strong supply level seems to have formed at the $0.00589 price level. Despite heightened market volatility, the bulls are struggling to break the $0.00589 price barrier. But with the appearance of higher support levels, the pressure increases at the key resistance, and it may give way soon.
Key Levels
- Resistance: $0.015, $0.016, and $0.017.
- Support: $0.007, $0.006, and $0.005.

Dash 2 Trade (D2TUSD) Price Analysis: The Indicators’ Point of View
The Bollinger Band indicates an upward Dash 2 Trade price channel as a higher low forms above the 20-day moving average. During the third 4-hour session, there was explosive bullish sentiment, but the bull market was unable to break beyond the key resistance level. This triggered a strong bearish sentiment, causing a temporary market dip to $0.0056 before the bulls managed to drive the market back up, forming a candlestick pattern known as a hanging man.

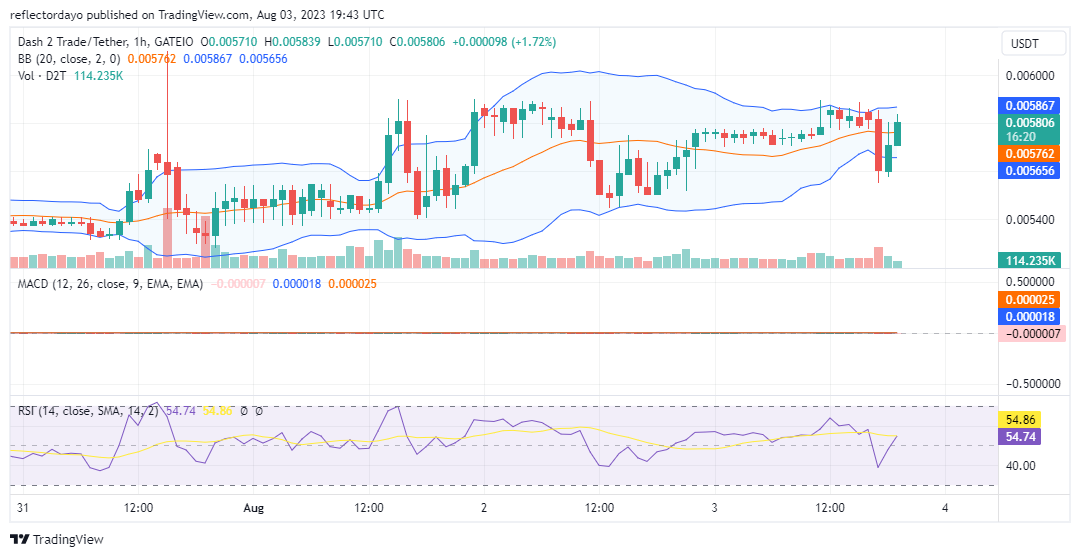
D2T/USD Short-Term Outlook: 1-Hour Chart
The outlook of the recent candlestick suggests that buyers are gaining momentum in the market and may soon take control. Although the bear market during the 17th hour session was very strong, bulls were able to form a support level at $0.0056, using it as a pivot to exert pressure back towards the resistance level.
The “Technical Events” feature is going live along with the Dash 2 Trade full open beta launch.
One feature that goes live together with the full open beta-launch is the “Technical Events”. In this thread we will give you a high level overview of what our users can expect from it! Let’s dive in 👇👇👇
The Technical Events is an in-house developed tool, designed &… pic.twitter.com/lbIFoPUkZN
— Dash 2 Trade (@dash2_trade) July 31, 2023
Do you want a coin with great potential for enormous returns? Dash 2 Trade (D2T) is that coin. Buy D2T now!


Leave a Reply