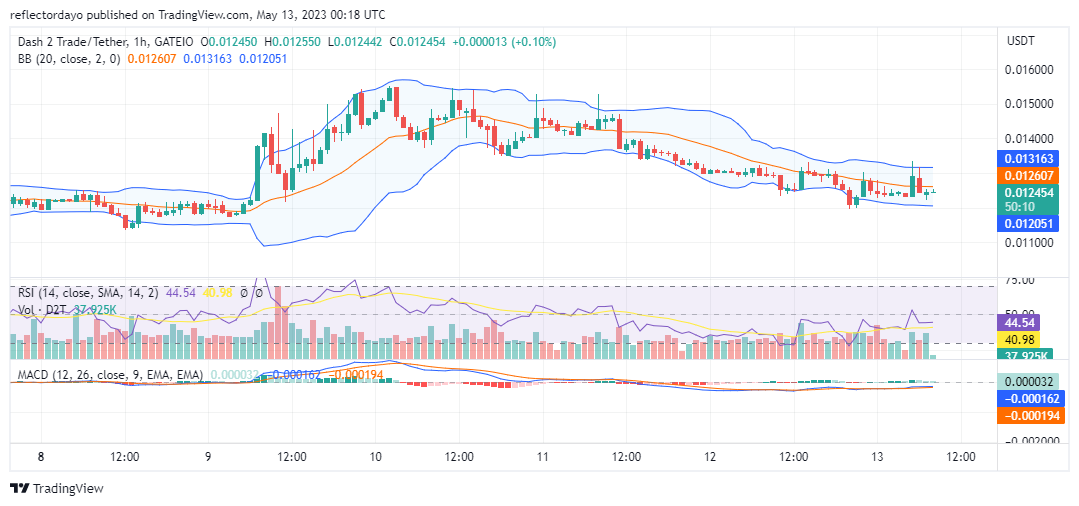
It has been tight in the D2T market since the daily session started. The market experiences pressure on both sides because there is high interest in the market by traders. Despite the struggle for market control, the price remains around $0.01246. Neither the bulls nor the bears could gain control of the price.
Key Levels
- Resistance: $0.035, $0.040, and $0.045
- Support: $0.015, $0.014, and $0.013
Dash 2 Trade (D2TUSD) Price Analysis: The Indicators’ Point of View
In the third 4-hour session, the tension reduces due to a steep decline in the volume of trade. This is why a doji candlestick appears to represent the third session. It seems like both the buyers and the sellers, for the time being, are losing interest after the faceoff in the earlier part of today. It could also be that traders are taking a recess. According to the indicators, the market is in the sell zone. But this gridlock experienced at the current price level might be an indication that the bearish trend is ending.

D2T/USD Short-Term Outlook: 1-Hour Chart
According to the Relative Strength Index (RSI), the selling pressure is reducing after a few appearances of bullish spikes in the market. But currently, the RSI line continues at level 44. The three indicators show the market in a bearish zone, but the momentum is on the decline. Therefore, this might be the time to place a long trade for a profitable return.
The Dash 2 Trade platform gives you access to unique social indicators and practical insights to keep you abreast of the constantly changing market.
📊👥 Want to make informed #Trading decisions?
✅Our platform provides you with exclusive social indicators and actionable insights to help you stay ahead of the curve in the ever-evolving #Cryptomarket.
Join the #D2T #Beta now – https://t.co/ExvBBjKIU6 🎉 pic.twitter.com/kppJ5MvIZO
— Dash 2 Trade (@dash2_trade) May 13, 2023
Do you want a coin with great potential for enormous returns? Dash 2 Trade (D2T) is that coin. Buy D2T now!


Leave a Reply