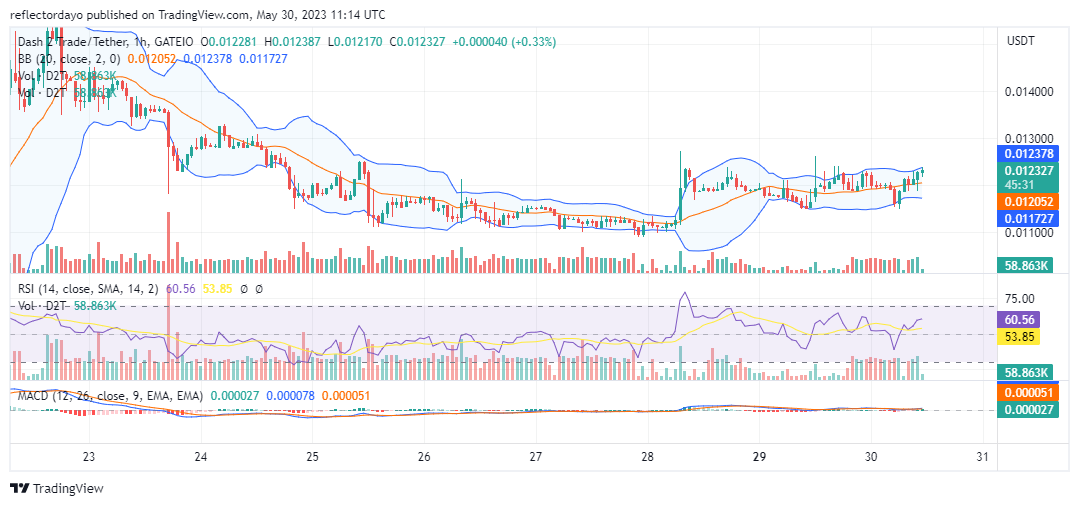
Dash 2 Trade’s bull market gained enough strength to charge at the $0.012 price resistance on May 28, but due to a considerably low volume of trade, the bullish price was cut short at the resistance level. However, because traders are willing to keep taking long positions, a higher support level was formed above the 20-day moving average. This nearby stronghold is putting a lot of pressure on the resistance level.
Key Levels
- Resistance: $0.020, $0.019, and $0.018
- Support: $0.010, $0.009, and $0.008

Dash 2 Trade (D2TUSD) Price Analysis: The Indicators’ Point of View
The second 4-hour session and the third 4-hour session suggest that bulls have the potential to take the market beyond the limit of $0.012. In the second session of the day’s market, we can see what looks like a hanging hammer. It is a sign that Dash 2 Trade buyers are pushing through the resistance. To this effect, the upper band of the Bollinger indicator responds, and the RSI line of the Relative Strength Index now measures at level 57.
D2T/USD Short-Term Outlook: 1-Hour Chart
From a 1-hour outlook, the Bollinger Bands now begin to illustrate an upward-moving price channel. Also, as volatility increases, we see the bands diverging. The market may be ready to enter higher price zones because bullish sentiment is growing.
The D2T platform brings the latest economic news to your fingertips.
⚡️Today in #Crypto – 30th May
📰1/ Russia’s Shift in Crypto Strategy: National Exchange Plans Abandoned, Focus Turns to Regulation
✔️ Russia has opted to cancel its national #Crypto exchange plans.
✔️ The government’s new approach prioritizes industry regulation and support… pic.twitter.com/dywzSzbYTB— Dash 2 Trade (@dash2_trade) May 30, 2023
Do you want a coin with great potential for enormous returns? Dash 2 Trade (D2T) is that coin. Buy D2T now!


Leave a Reply