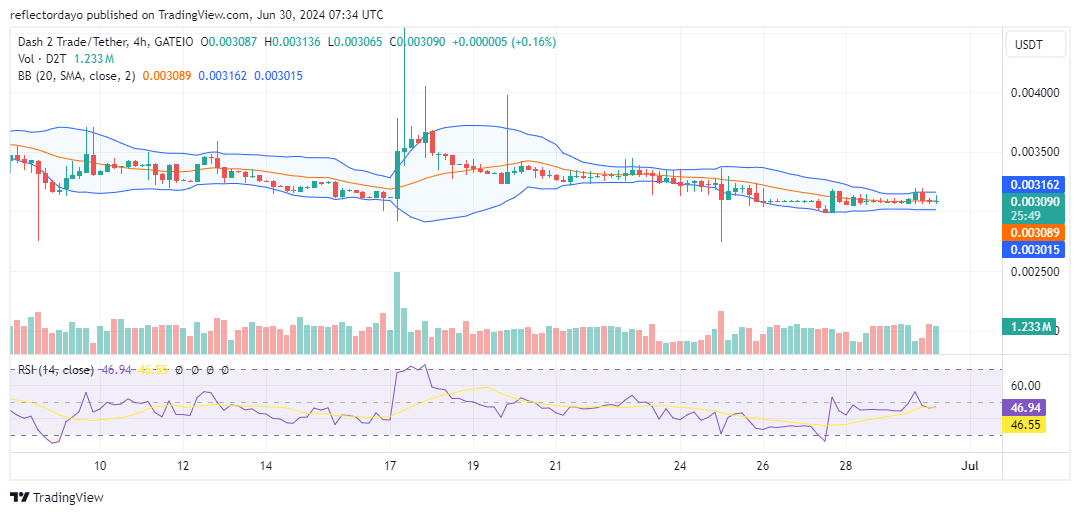
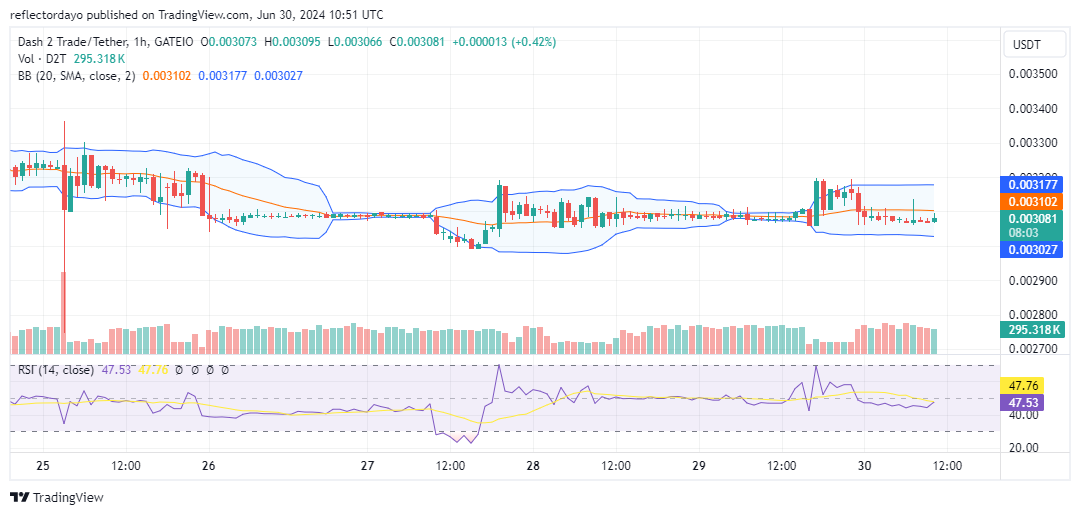
The D2T/USD market dropped below $0.0032, finding support at the $0.0031 price level. Since the emergence of bullish activity at $0.0031, the market has stabilized as bulls and bears struggle for dominance. Despite multiple attempts by bulls to push the price back up to $0.0032, these efforts have been unsustainable. For now, the market remains steady at the $0.0031 level.
Key Levels to Watch:
- Resistance: $0.015, $0.016, and $0.017
- Support: $0.0020, $0.0018, and $0.0017

Dash 2 Trade Price Analysis: The Indicators’ Point of View
After the market settled at the $0.0031 price threshold, demand and supply reached equilibrium. Despite the slight dip from $0.0032 to $0.0031, bearish momentum fizzled out below this critical support level. Consequently, recent trading sessions have shown the appearance of Doji candles, with the Bollinger Bands converging to form a narrow price channel. This narrowing of the Bollinger Bands indicates a decrease in market volatility, which typically precedes a significant price move. In this case, the move might be upward, as the market appears to have found stability at $0.0031 and is unlikely to dip further below this level.

D2T/USD Short-Term Outlook: 1-Hour Chart
Similar to the D2T/USD market behavior observed on the 4-hour chart, the market continues to maintain support at the $0.0031 level. A closer examination reveals that most price swings have been to the upside rather than below this level. This indicates underlying bullish strength, which may eventually lead to a significant upward price movement.
Breakouts release prices from the range that channels have locked them in! For optimum profits, learn how to ride the trend and trade the breakout!
Channels lock prices in a range, and breakouts set them free!
Learn how to trade the breakout and ride the trend for maximum gains!
Check out our latest article:
— Dash 2 Trade (@dash2_trade) June 25, 2024
Do you want a coin with great potential for enormous returns? Dash 2 Trade (D2T) is that coin. Buy D2T now!


Leave a Reply