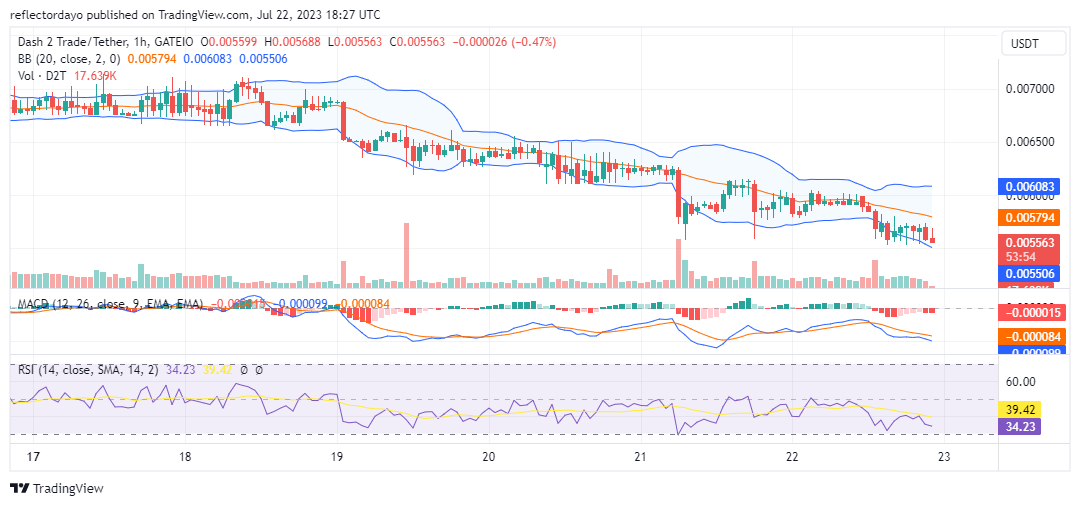
Under the heavy bearish pressure, the D2T bulls are being forced to shift ground into the $0.00600 price zone. The Dash 2 Trade bears seem to be gaining the upper hand after a prolonged period of indecision. However, the presence of the bulls in the market can still be felt as bears now face a barrier at $0.00581.
Key Levels
- Resistance: $0.015, $0.016, and $0.017
- Support: $0.007, $0.006, and $0.005.
Dash 2 Trade (D2TUSD) Price Analysis: The Indicators’ Point of View
The indicators are pointing to a bear market. The D2T market began to move in a bearish way as buyers lost grip on the $0.006406 price level. The Bollinger Bands indicator is beginning to indicate a downward-moving price channel. However, it seems like bulls may have found solid ground at the $0.005595 price level, and the market may bounce from here.

D2T/USD Short-Term Outlook: 1-Hour Chart
From this standpoint, we discover that the market continues to hold its ground at the newly secured demand level. It appears like bears may have hit a brick wall, and the market may turn in an upside direction from here. Another bullish reversal sign for bulls to watch out for is the two lines of the Moving Average Convergence and Divergence (MACD) indicator. They are about to cross each other in the selling zone. The crossing of these two lines in the sell zone will be a sign that the bull market is gaining momentum.
Stay on top of your trading game with the Dash 2 Trade platform.
1/10
Supercharge #ChatGPT to become the most efficient #crypto researcher to date & save countless hours on your research.Today we are looking at 3 crypto tools using chatGPT: DefiLIama, SIC and SignalPlus- Below a thread on our closer look at these tools. pic.twitter.com/qRNUUWmhao
— Dash 2 Trade (@dash2_trade) July 22, 2023
Do you want a coin with great potential for enormous returns? Dash 2 Trade (D2T) is that coin. Buy D2T now!


Leave a Reply