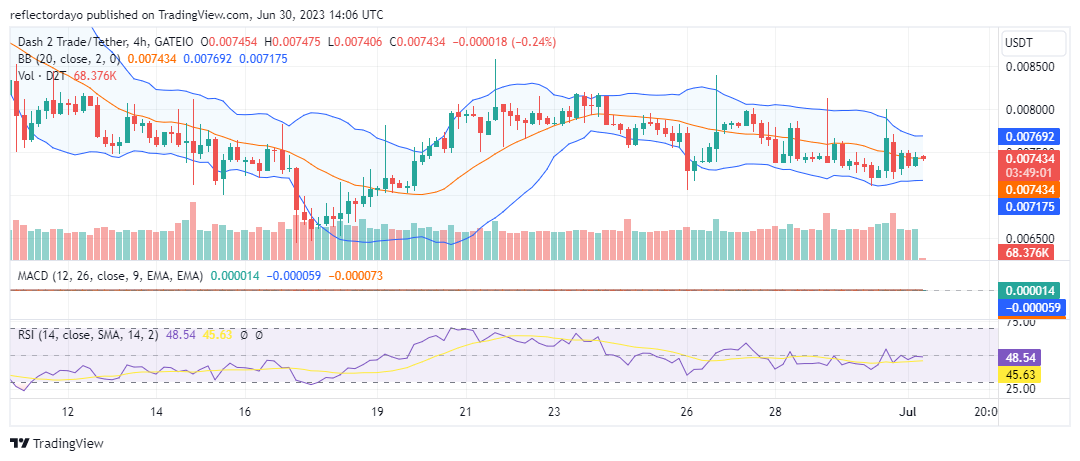
The D2T/USD pair has kept a firm grip on the $0.00727 since June 26 as a support level to wear off the bearish pressure, even though the $0.007 is bull’s last line of defense. Since June 26, sellers have kept pressurizing the demand level, but the $0.00727 have refused to give way.
Key Levels
- Resistance: $0.015, $0.016, and $0.017
- Support: $0.007, $0.006, and $0.005.

Dash 2 Trade (D2TUSD) Price Analysis: The Indicators’ Point of View
Since June 26, we have discovered the D2T/USD pair has been making lower peaks and lower resistance levels. This reveals the increase in pressure on the position of bulls in the market.
However, it is looking like the new month will favor the bulls, as we are beginning to notice a significant recovery in the bull market. The price is now at the level of the moving average. In confirmation of this, the Relative Strength Index line is now measuring at its midpoint.

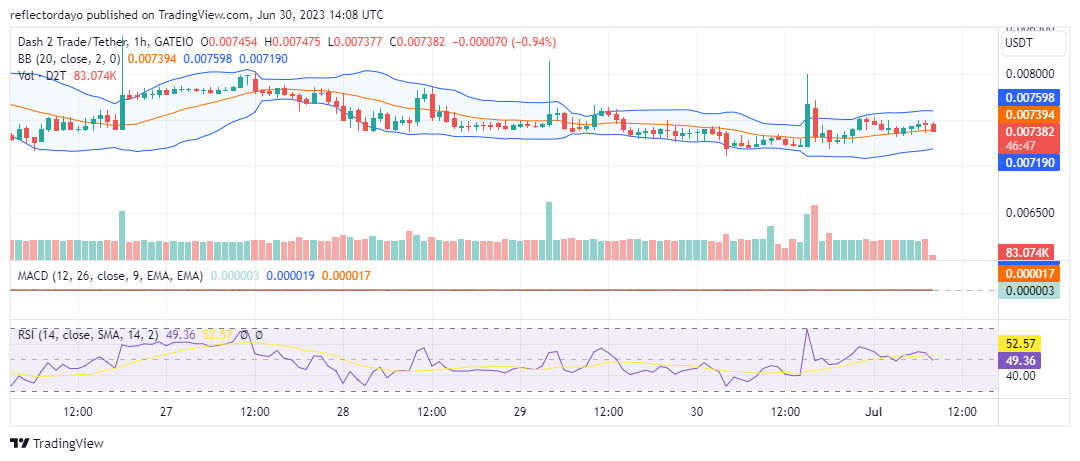
D2T/USD Short-Term Outlook: 1-Hour Chart
The Bollinger Bands indicator from a 1-hour chart outlook on the market now reflects how the price channel is now changing direction to upside movement. The higher support level that formed above the 20-day moving average is responsible for turning the market in an upward direction.
A source of concern, however, is the near resistance at the $0.0075 price level, where the market is currently being turned back. Despite this, the bulls have the advantage over the bears because their baseline is above the 20-day moving average.
Backtesting emphasizes the critical relevance of identifying trading methods that fail in addition to the pursuit of successful trading techniques.
Quote of the day from the D2T team
“Backtesting goes beyond the pursuit of finding successful trading strategies; it also emphasizes the crucial importance of recognizing strategies that do not work.”
Start backtesting today!#Learn #trading
— Dash 2 Trade (@dash2_trade) June 29, 2023
Do you want a coin with great potential for enormous returns? Dash 2 Trade (D2T) is that coin. Buy D2T now!


Leave a Reply