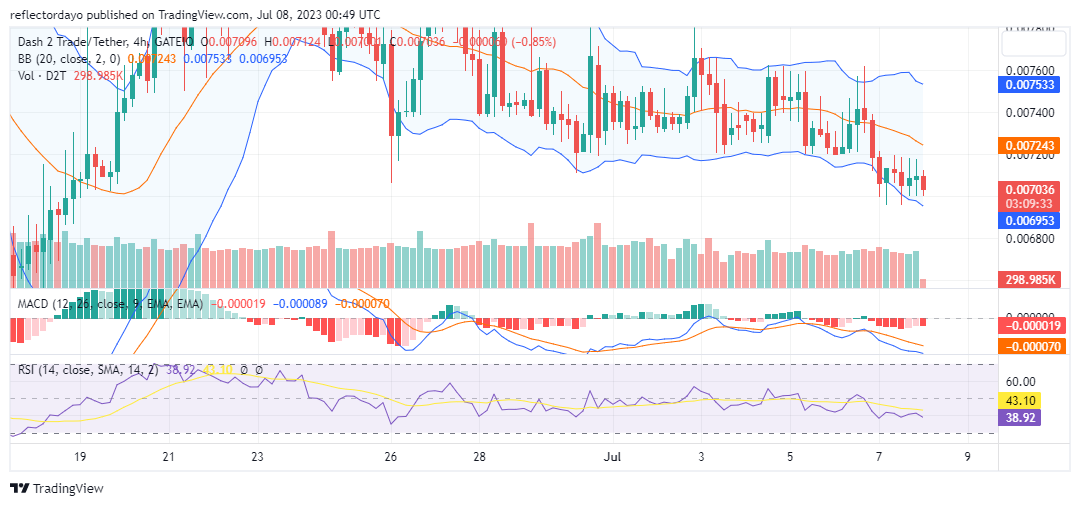
Currently, the market hovers along the edge of a major support level, which is the $0.007 price level, with repeated appearances of spinning top candlesticks. This is a pointer to the fact that the bull market is gaining momentum in its current position near the $0.007 price level. Therefore, a rebound is very likely at this level.
Key Levels
- Resistance: $0.015, $0.016, and $0.017
- Support: $0.007, $0.006, and $0.005.

Dash 2 Trade (D2TUSD) Price Analysis: The Indicators’ Point of View
Looking at the Dash 2 Trade market from the perspective of the Moving Average Convergence and Divergence (MACD) indicator, the faded red histograms suggest weakening bearish momentum as the market ranges along the edge of the $0.007 price level.
The repeated appearance of a bullish spinning top candlestick pattern can be a potential indication that the bulls are gaining strength and attempting to turn the market in their favor. Bullish spinning tops represent a period of indecision in the market where neither buyers nor sellers are able to establish strong control.

D2T/USD Short-Term Outlook: 1-Hour Chart
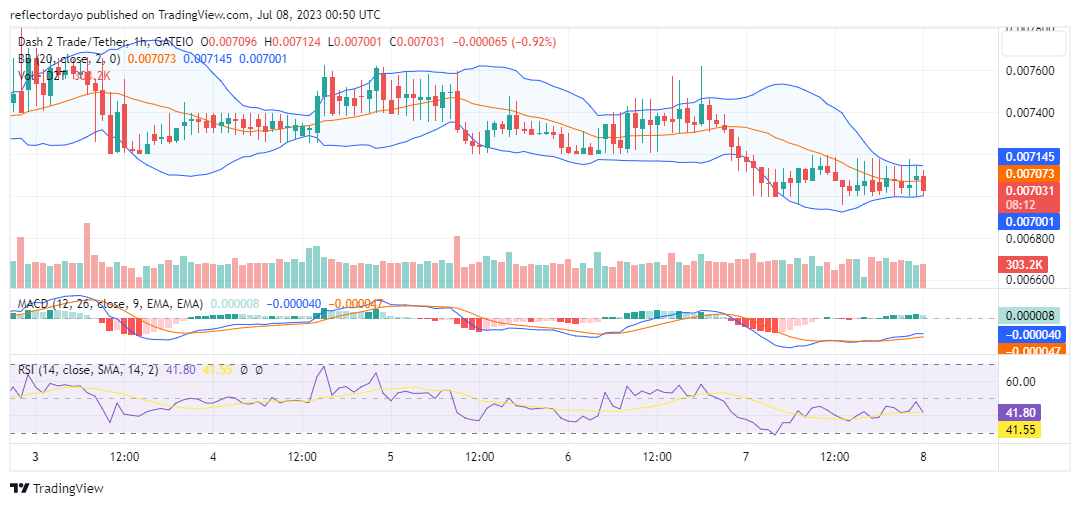
From the 1-hour chart perspective, the price action and the 20-day moving average are moving horizontally along with the $0.007077 price level. The candlesticks representing each 1-hour session since the 16th hour of the previous daily trading session have been characterized by spinning top candlestick patterns and long-legged dojis. Currently, the Bollinger bands are contracting against the price action, creating a narrow price channel. This is a sign of a potential buildup for an imminent price breakout.
Since BlackRock filed for its crypto fund, Bitcoin has increased by 25%.
We’re so back 🥳$BTC New yearly high at $31568⬆️
Bitcoin rallied 25% since #BlackRock filed for it’s crypto fund pic.twitter.com/bX2lYlsraI— Dash 2 Trade (@dash2_trade) July 6, 2023
Do you want a coin with great potential for enormous returns? Dash 2 Trade (D2T) is that coin. Buy D2T now!


Leave a Reply