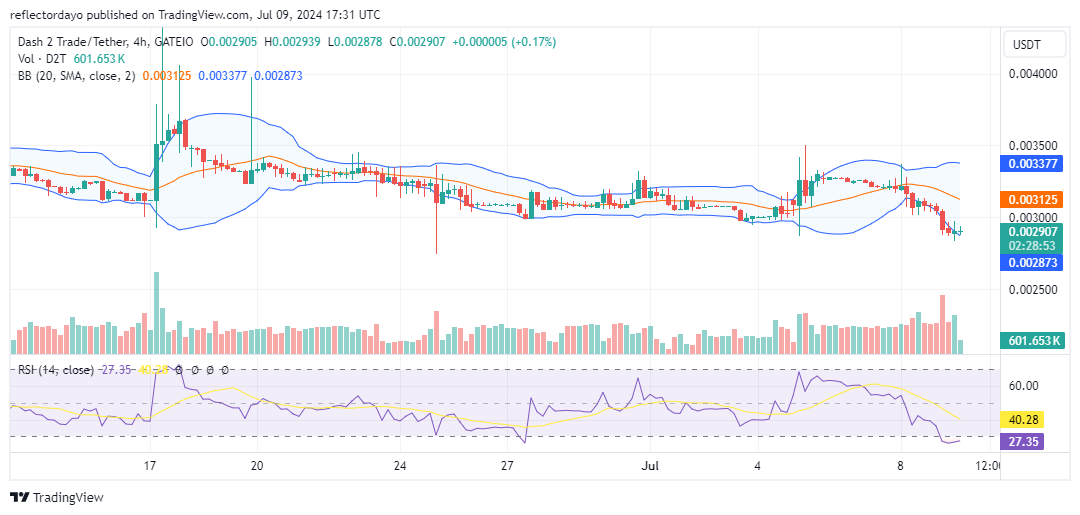
Relentless bearish pressure that caused the breakdown of the market slightly below $0.003 has challenged bulls to take action below the level. The key question is whether the bulls can withstand the pressure and achieve a recovery. Analyzing today’s market activity will provide clues as to whether the bulls can sustain a rally and break the horizontal price channel that has persisted for some time.
Since mid-June, the Dash 2 Trade market has maintained a horizontal price channel between $0.003 and $0.0035. The $0.003 level has served as the support level, holding firm against persistent bearish pressure. However, earlier today, the market broke below this support level, raising concerns about a potential massive sell-off. Despite this, a massive sell-off may not be feasible, as a thorough analysis of the chart and indicators reveals other factors to consider.
Key Levels to Watch:
- Resistance: $0.015, $0.016, and $0.017
- Support: $0.0020, $0.0018, and $0.0017

Dash 2 Trade (D2T/USD) Price Analysis: The Indicators’ Point of View
During the second 4-hour session today, the Dash 2 Trade market experienced a strong sell-off that caused the price to drop below the $0.003 support level. While breaking this longstanding support might raise concerns, the market may not continue on a bearish trajectory despite the breakdown at $0.003. This is because the market has found solid ground near this crucial level and is beginning to bounce back. The $0.0029 price level, being close to $0.003, suggests a test of the support level rather than a continued decline.
Additionally, an analysis of the trade volume histogram indicates that, apart from the significant volume spike early this morning, subsequent histograms lack the strength to support ongoing bearish price action. The price action has flattened below the $0.003 level, indicating that bears are likely exhausted. Furthermore, the Relative Strength Index (RSI) indicator shows an oversold market condition, which typically precedes a market correction. This expected correction could help the market rally significantly.

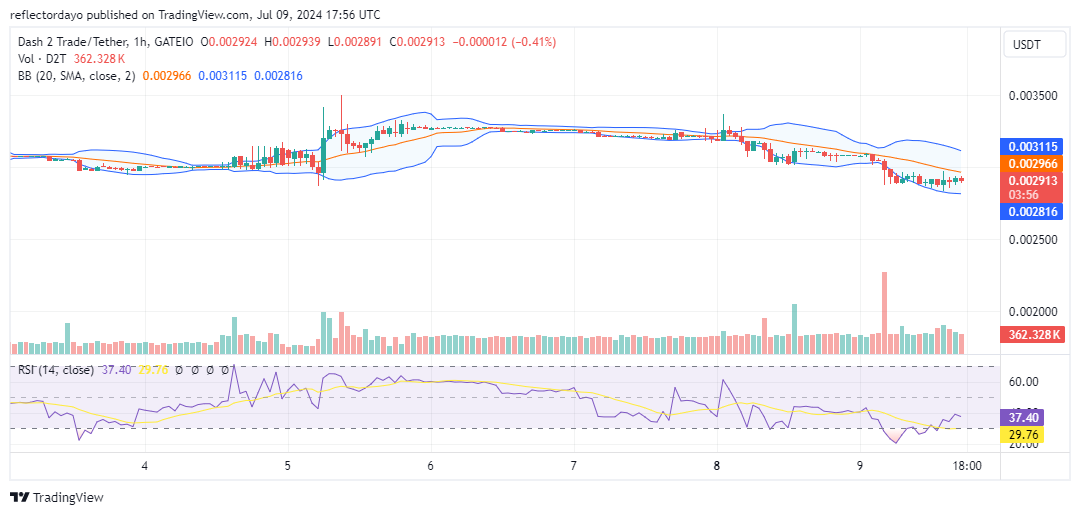
D2T/USD Short-Term Outlook: 1-Hour Chart
A closer look at the 1-hour chart reveals a contrasting picture compared to the 4-hour timeframe. The market has struggled below the $0.003 price level for a sustained period, and the Bollinger Bands currently exhibit a downtrending pattern. This suggests a potential shift in momentum compared to the potentially consolidating behavior observed on the 4-hour chart.
Consequently, the $0.003 level could act as resistance in the near term, considering the extended period of selling pressure below this point. This short-term bearish outlook contrasts with the potential for consolidation suggested by the 4-hour chart.
However, historical price action indicates that the $0.003 level has been tested multiple times in the past. This could potentially encourage bulls to re-enter the market, leading to a buying opportunity (dip) that might trigger a price surge.
After a full day, these are the top 5 Smart Money purchases:
🚀Smart Money Insights📊
Smart Money is individuals & entities who are seen as experienced & informed, often signaling future trends.
These are the top 5 Smart Money buys past 24-hours:$UNI$WLD$ENA$INJ$ANDY
Check out our Discord for deep dives on Smart Money activity pic.twitter.com/BkTRpiQyzY
— Dash 2 Trade (@dash2_trade) July 9, 2024
Click the following link to buy Dash 2 Trade: Buy D2T now!


Leave a Reply