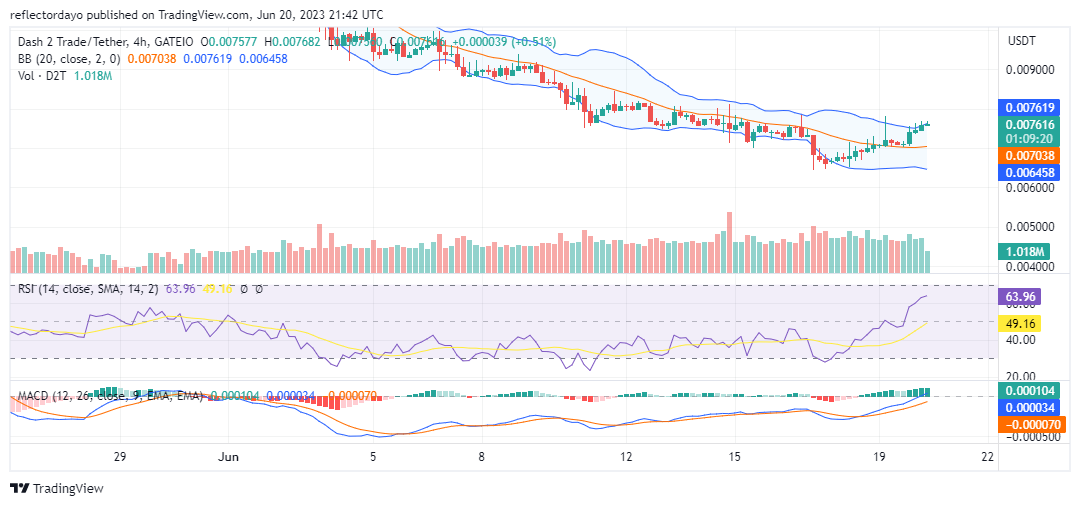
The demand for the D2T coin is exceeding its supply as bullish sentiment gains momentum from the $0.006516 support level. The appearance of a spinning top candle on June 18 suggests that bears are weakening. Therefore, the market is more likely to continue its movement in a bullish direction.
Key Levels
- Resistance: $0.015, $0.016, and $0.017
- Support: $0.007, $0.006, and $0.005.

Dash 2 Trade (D2TUSD) Price Analysis: The Indicators’ Point of View
The D2T and US dollar pair is currently trading above the 20-day moving average. In response to this new market development, the Bollinger Bands begin to diverge, meaning that liquidity is equally increasing in both the bull market and the bear market.
Although the increase in liquidity in both markets is a double-edged sword, bulls have more chances in the market than bears. According to the Relative Strength Index (RSI), the buying momentum is measured at 64.22.

D2T/USD Short-Term Outlook: 1-Hour Chart
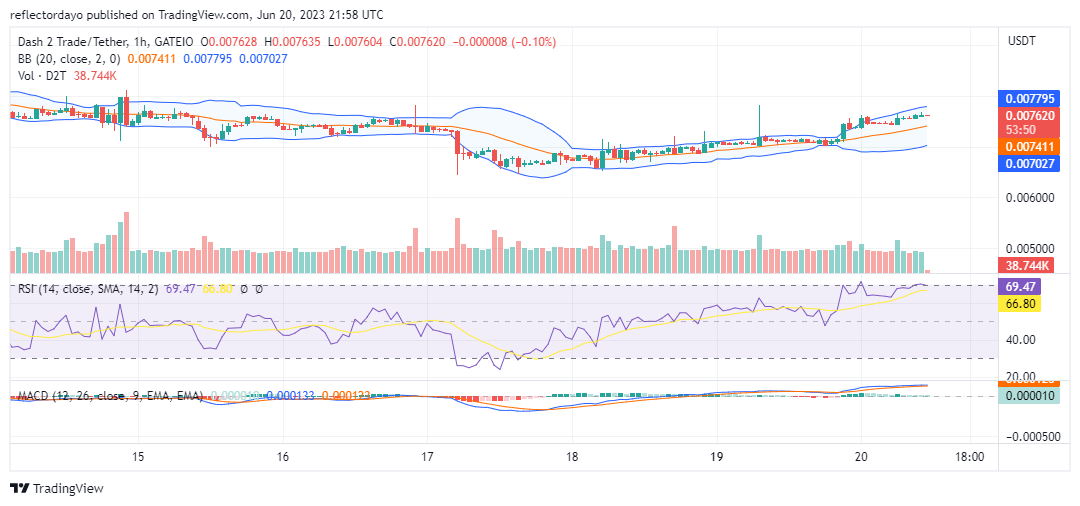
The Bollinger Bands indicator from the 1-hour timeframe portrays a very progressive advancement of the D2T bulls toward the $0.008 price level. However, the liquidity in the bear market appears to be causing resistance at $0.0077. Bulls still retain a slight advantage over bears, and the market target seems attainable before today’s trading session runs out.
11/ Realized profit and loss on exchanges today lies at or near net zero, lending credence to the idea that new entrants were responsible for the sell-off. This trend resembles previous instances of market indifference near the end of bear markets.
11/ Looking at ‘realized profit and loss’ on exchanges, it currently sits at around net zero, supporting the notion that recent entrants were driving the sell-off. This pattern echoes past periods of market apathy at the end of bear markets.
— Dash 2 Trade (@dash2_trade) June 19, 2023
Do you want a coin with great potential for enormous returns? Dash 2 Trade (D2T) is that coin. Buy D2T now!


Leave a Reply