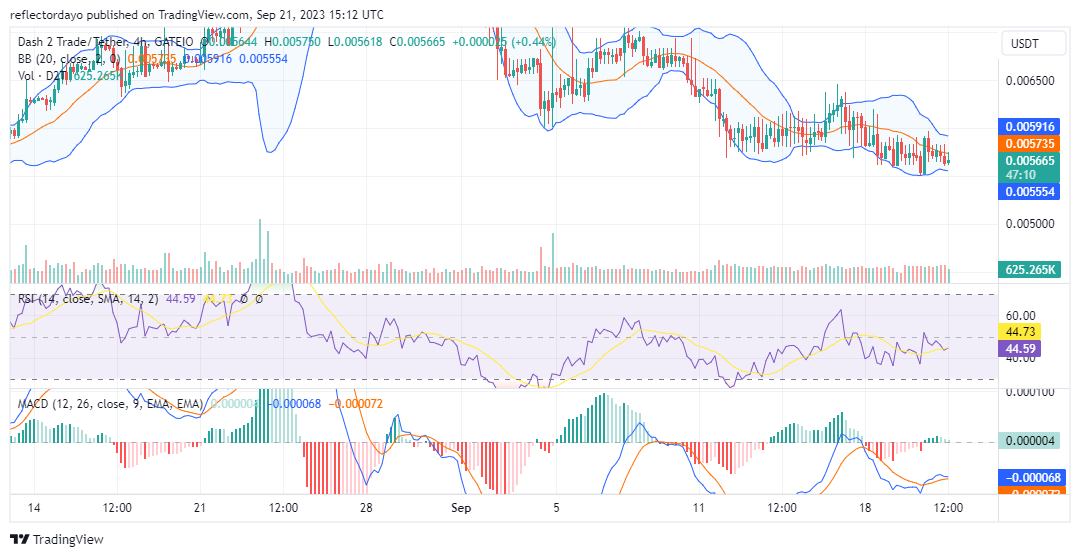
In recent trading sessions, Dash 2 Trade has exhibited a resilient sideways movement within a relatively tight price range, primarily centered around the $0.0060 level. This intriguing price action is marked by notable swings both above and below this key level, creating an environment of uncertainty and anticipation in the market.
Key Levels
- Resistance: $0.010, $0.011, and $0.012.
- Support: $0.005, $0.004, and $0.003.

Dash 2 Trade (D2TUSD) Price Analysis: The Indicators’ Point of View
As the ongoing battle between supply and demand persists, the bears have successfully driven the price lower, prompting the Dash 2 Trade bulls to shift their position from the $0.006 mark to regroup at the $0.0055 price level. While a rebound is anticipated from this level, the bulls are encountering resistance around the $0.006 price point.
A careful analysis of both the Relative Strength Index (RSI) and the Moving Average Convergence and Divergence (MACD) indicator reveals that, despite the market’s sideways movement, it currently resides within the sell zone. While the bullish stance is indeed under pressure from bearish forces, maintaining a strong foothold on the support level could eventually erode the bearish pressure, potentially paving the way for a price rally from this critical juncture.

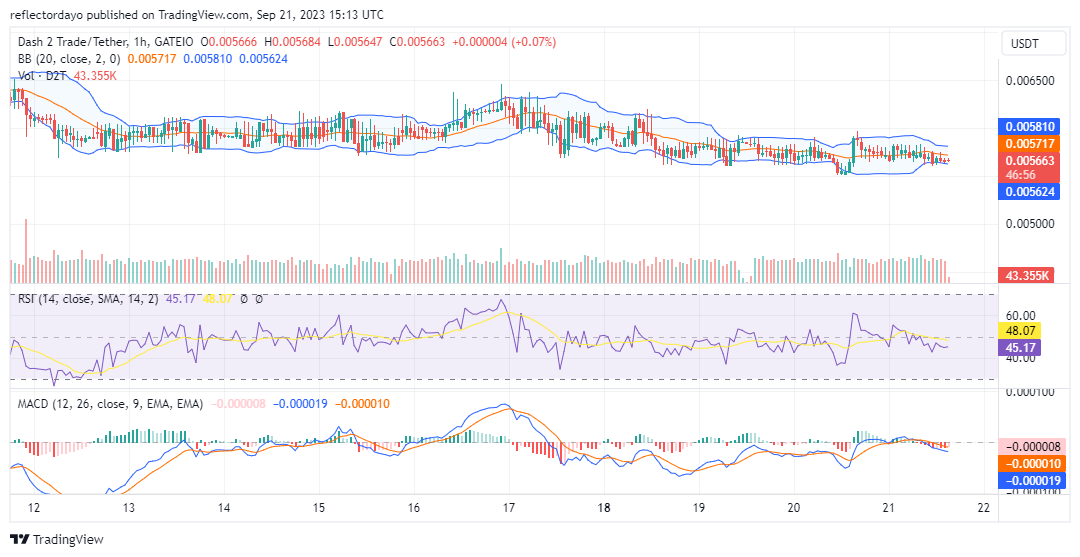
D2T/USD Short-Term Outlook: 1-Hour Chart
While the current market trend appears to be oriented towards the east, it is essential to acknowledge the heightened levels of volatility prevailing. This elevated volatility may facilitate the emergence of a clear market direction. However, given the substantial clash between bullish and bearish sentiment in the trading arena, it appears that a temporary cooldown in volatility may be necessary to provide either camp with the opportunity to assert dominance and establish a definitive market trajectory.
The Relative Strength Index, which measures the magnitude of recent price changes, has been oscillating rapidly around the 50 level, indicating a market that is finely balanced between buying and selling pressure. This midpoint level is a critical zone that often serves as a pivot for determining trend strength. The ongoing fluctuation around this point suggests that traders are eagerly awaiting a catalyst to tip the scales in one direction or another.
Learn what to look for and gain a shrewd perspective on the price action of your chosen cryptocurrency to help you place more profitable trades.
Why pump? ❓
Well, because of supply and demand of course 😉
However, there’s a lot more going on behind the scenes.
Get a smart perspective on your favorite crypto’s price action and learn what to look for so you can make more successful trades.
— Dash 2 Trade (@dash2_trade) September 21, 2023
Do you want a coin with great potential for enormous returns? Dash 2 Trade (D2T) is that coin. Buy D2T now!


Leave a Reply