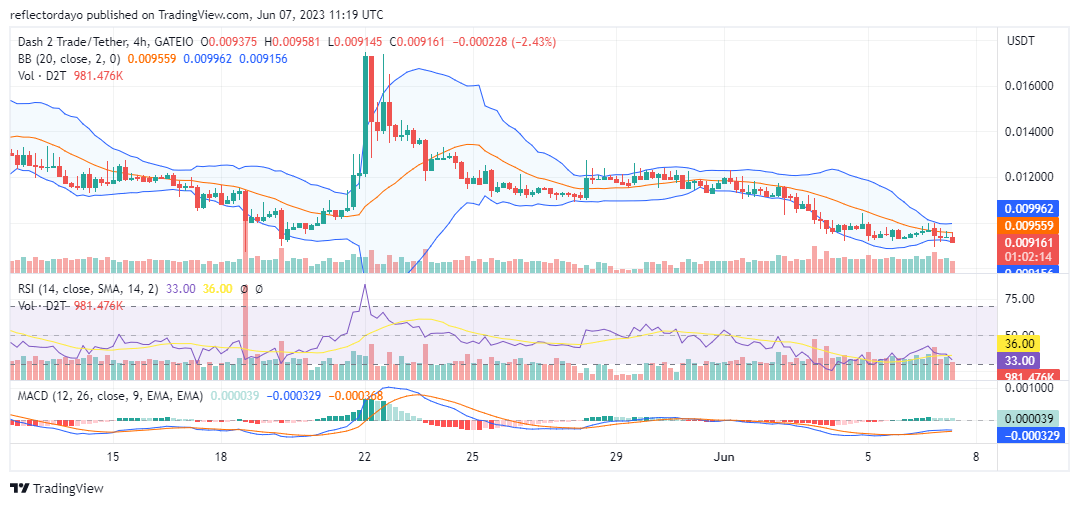
The $0.01 price level was formally a strong support level for the D2T bull market, but bears became stronger and claimed this price level as their new supply line. However, bulls are not letting go of the price level that easily. They secured a near-support level at $0.0094, and they have continued to make repeated efforts to reclaim the price level.
Key Levels
- Resistance: $0.015, $0.016, and $0.017
- Support: $0.009, $0.008, and $0.007

Dash 2 Trade (D2TUSD) Price Analysis: The Indicators’ Point of View
The D2T bullish struggle to reclaim the $0.01 price level is now being illustrated by the Bollinger Bands indicator: the bands are contracting. This means there is about to be a price breakout soon. It is most likely to be a bullish price breakout. This is because the price action, being near the threshold of the oversold region, is more likely to move in an upward direction than continue to the downside.

D2T/USD Short-Term Outlook: 1-Hour Chart
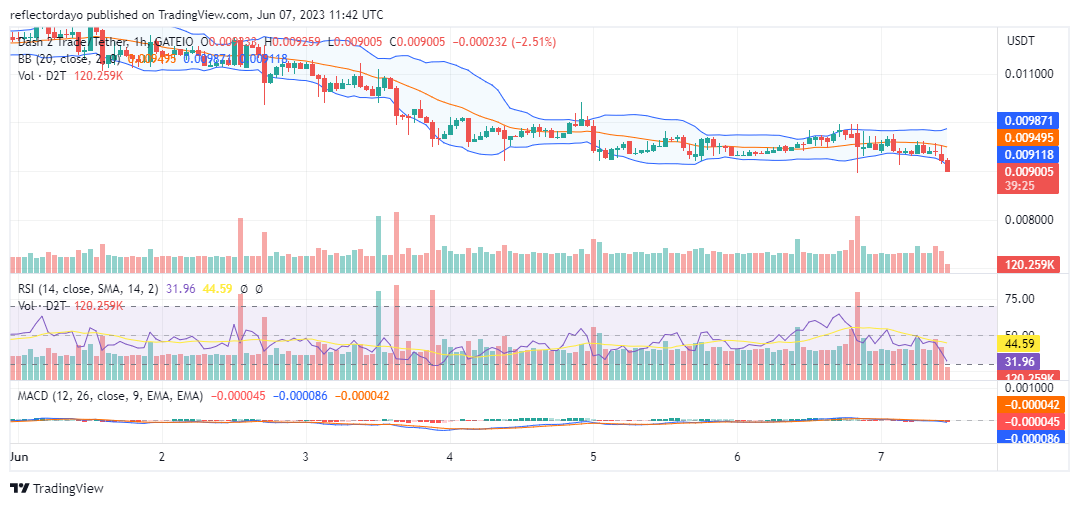
From the 1-hour chart standpoint, the market has swung below the 20-day moving average, but at the $0.0094 price level bulls had continued to be strong around the level. However as volatility grows in the market, there is the possibility that the market may first slide until it reached the $0.009 price level before it bounces up again. The current bearish move may stimulate a response in the D2T bull market. According to the Bollinger Bands indicator, if the market moves quickly to the $0.009 price mark it will be moving into the oversold territory and this will contribute to the price rally to the $0.01 price mark.
Follow the latest news and trends in the crypto space. With the Dash 2 Trade platform, you will be updated with the latest crypto news.
The numbers don’t lie. pic.twitter.com/lec4wkp6RO
— Coinbase 🛡️ (@coinbase) June 6, 2023
Do you want a coin with great potential for enormous returns? Dash 2 Trade (D2T) is that coin. Buy D2T now!


Leave a Reply