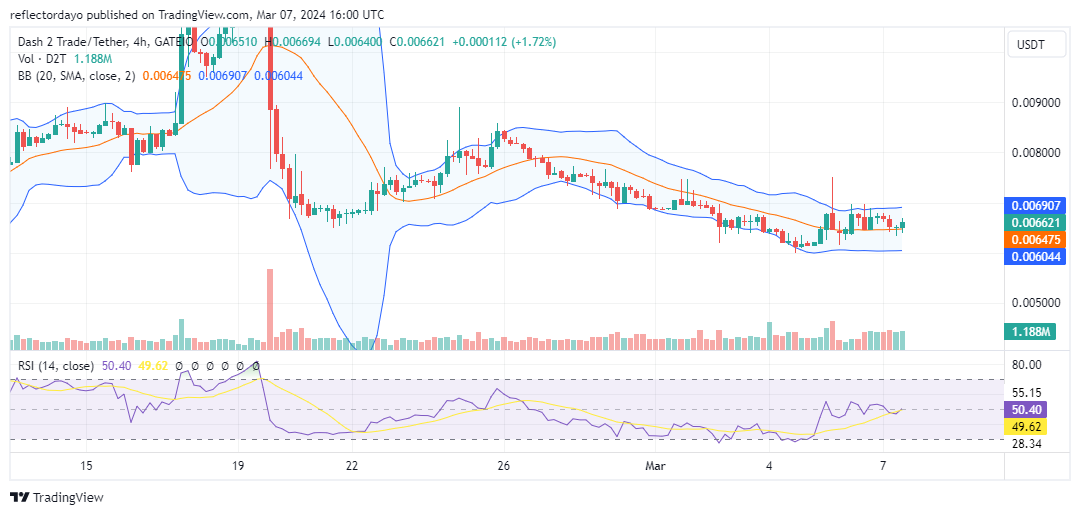
The $0.0065 price level stands as a battleground in the Dash 2 Trade market. This level previously halted the decline from the February 19th high of $0.013, where bulls valiantly defended against bearish pressure. While attempts to push higher were unsuccessful, bulls have now recaptured this critical support.
Key Levels to Watch:
- Resistance: $0.015, $0.016, $0.017
- Support: $0.004, $0.0035, $0.003

Dash 2 Trade (D2T/USD) Price Analysis: The Indicators’ Point of View
Despite consolidating at this crucial support, the market faces immediate resistance at $0.0068, highlighting continued bearish activity. While the Bollinger Bands hint at a slight bullish bias due to the price positioning above the 20-day moving average, the Relative Strength Index (RSI) suggests a neutral market.
Further sideways movement around the current price level could lead to a convergence of the Bollinger Bands, mirroring the RSI’s current consolidation around the 50 level. This phenomenon, known as a volatility squeeze, often precedes a significant breakout, potentially favoring the bulls.

D2T/USD Short-Term Outlook: 1-Hour Chart
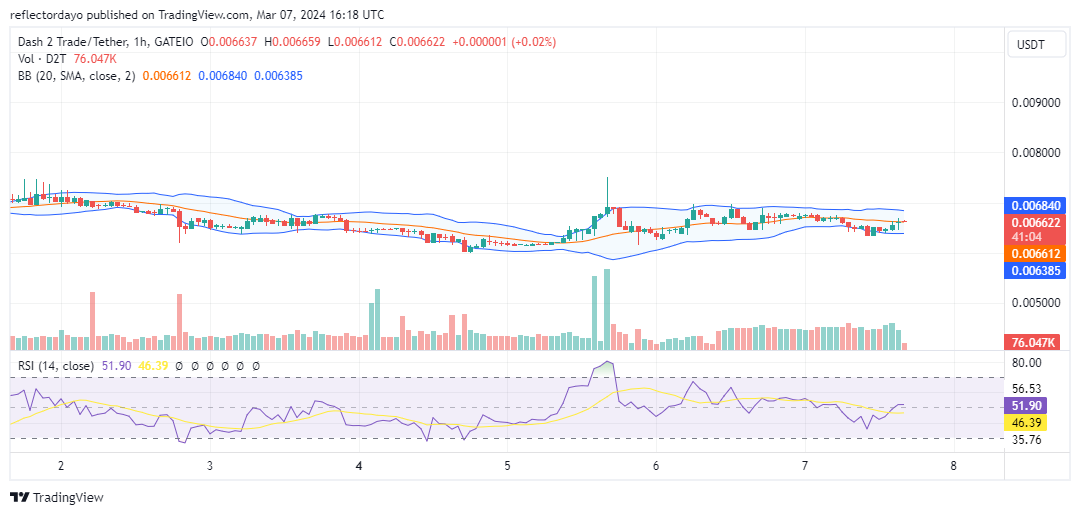
The 1-hour chart reveals continued consolidation at $0.0065, a pattern often preceding a clear directional shift. The recent flattening of price action in the last two 1-hour sessions hints at a potential breakout in the near future.
Make the most of this bull run by taking the plunge with the help of our fast start tips.
It’s never been easier to start bot trading! 🤖
Take the leap with our quick start guides and make the most of this bull run.📊https://t.co/MwBY8Q7TFHhttps://t.co/jaVTLXmIx7 pic.twitter.com/86AY4gn55q
— Dash 2 Trade (@dash2_trade) March 6, 2024
Do you want a coin with great potential for enormous returns? Dash 2 Trade (D2T) is that coin. Buy D2T now!


Leave a Reply