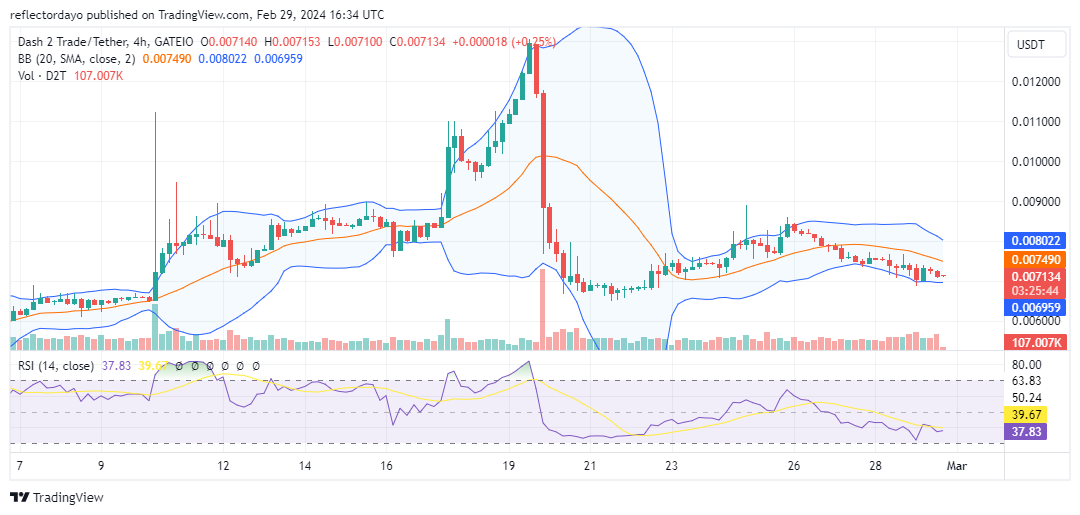
The D2T/USD market experienced a significant price surge over the weekend but encountered resistance at the $0.009 level, leading to a downward trend. However, this pullback is finding support around the $0.007 level, suggesting a potential for renewed upward momentum similar to last week’s rally.
Key Levels
- Resistance: $0.015, $0.016, and $0.017
- Support: $0.004, $0.0035, and $0.003.

Dash 2 Trade (D2T/USD) Price Analysis: The Indicators’ Point of View
While technical indicators, such as the price being below the 20-day moving average of the Bollinger Bands indicator and the RSI below 50, suggest a bearish market, bulls are finding support at the historically significant $0.007 level. This support level, coupled with the recent rally similar to last week’s, indicates the potential for a trend reversal. As we can already see, the bearish momentum is on a decline, possibly, the D2T/USD market will soon start swinging high.

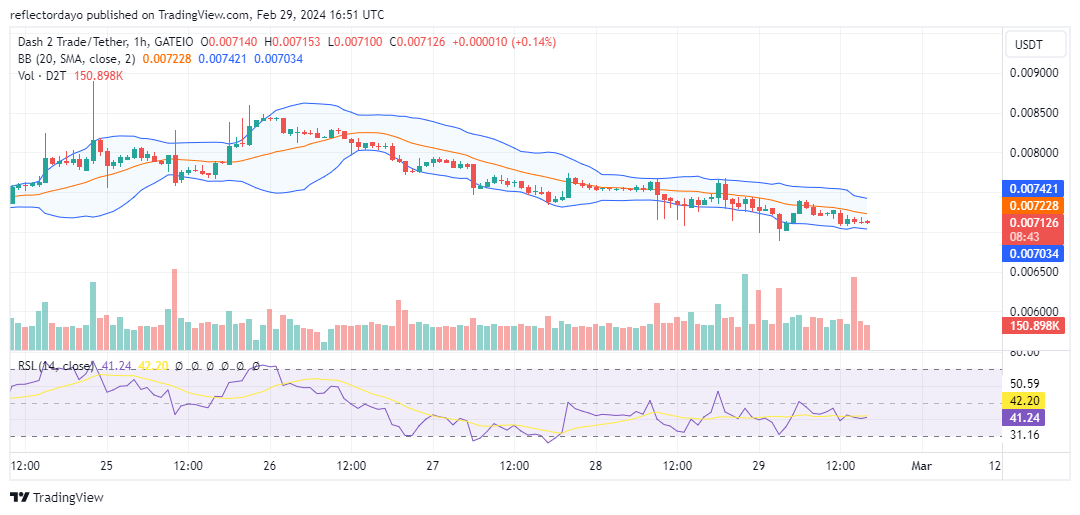
Dash 2 Trade Short-Term Outlook: 1-Hour Chart
The intensifying struggle between buyers and sellers is reflected in the recent doji formations, which can sometimes signal a potential reversal following a downtrend. The $0.013 level could be a potential target. While the market may encounter strong resistance at the $0.013 price level, bulls may find a higher support level that will keep the market upward-bound.
At Dash 2 Trade Headquarters, this month has been fruitful and satisfying.
📊 Dash 2 Trade launch month in review 📅
It’s been a productive, and rewarding month at Dash 2 Trade HQ. 💼
We came through in a big way with the launch of subscriptions, marking the app’s soft launch.🚀
Here’s everything you need to know about our development journey in… pic.twitter.com/UJHiZi1EsZ
— Dash 2 Trade (@dash2_trade) February 29, 2024
Do you want a coin with great potential for enormous returns? Dash 2 Trade (D2T) is that coin. Buy D2T now!


Leave a Reply