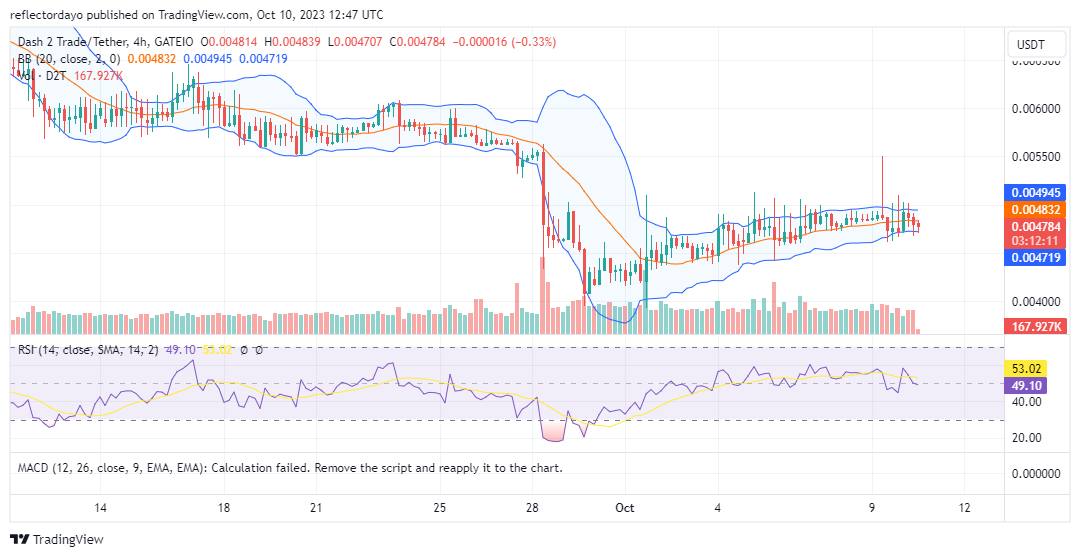
In the D2T/USD market, the $0.0050 price level was established on the first day of October, when bullish momentum propelled the market to this level. However, the bulls were unable to maintain their position, leading to a subsequent retreat. Since that time, the resistance level has remained steadfast, even as the bullish trend gained momentum, resulting in a series of higher lows and increasing pressure on the bearish stance at the $0.005 price level.
As anticipated, the bulls successfully breached the resistance on October 9th. Nevertheless, their ability to sustain this higher position proved fleeting. Consequently, the market retraced below the support level.
Key Levels
- Resistance: $0.010, $0.011, and $0.012.
- Support: $0.005, $0.004, and $0.003.

Dash 2 Trade (D2T/USD) Price Analysis: The Indicators’ Point of View
The D2T/USD bear market, which commenced at the peak of $0.0055, exhibited remarkable strength in response to the exceedingly bullish performance during the preceding trading session. This bearish momentum proved formidable, compelling the bulls to establish a new pivotal support level slightly lower than the previous one, at $0.00476. Presently, the bears have regained control at the $0.005 level, while the bulls are consolidating around $0.0047 in preparation for a renewed attempt to breach the resistance.
One encouraging factor pointing toward the possibility of this breakout is the convergence observed in the Bollinger Bands indicator. As the market maintains an upward-trending price channel, the narrowing of the Bollinger Bands as they approach a significant resistance level suggests a potential accumulation of bullish momentum. D2T/USD Traders may interpret this as a prelude to a breakout beyond the resistance level, which, if successful, could usher in a sustained uptrend.

D2T/USD Short-Term Outlook: 1-Hour Chart
Upon closer examination of this shorter timeframe within the market, an alternative scenario becomes apparent. It appears that the market is engaged in a sideways range at this particular level. Notably, the presence of long-legged dojis indicates active participation from both bulls and bears. Nevertheless, the prevalence of candlesticks featuring longer upper shadows than lower shadows suggests heightened selling activity around the $0.005 price level.
Conversely, a recent trend has emerged with the repeated appearance of candlesticks characterized by longer, lower shadows. This shift implies that the bulls are increasingly asserting themselves at the support price level. This evolving pattern warrants close monitoring, as it may indicate a potential shift in market dynamics.
A green monthly Bitcoin candle that deviated from tradition in September. However, the market looks for more potent drivers of long-term confidence.
🔍 Smart Money Insights🚀
September broke tradition with a green monthly Bitcoin candle. The market, though, seeks stronger catalysts for sustained confidence.
📊 Smart Money Stablecoin holdings: Slightly down to 14.6%, from a summer low of 12-13%.
🔄 Stablecoin exchange flow:… pic.twitter.com/ZuvBJST7E3
— Dash 2 Trade (@dash2_trade) October 4, 2023
Do you want a coin with great potential for enormous returns? Dash 2 Trade (D2T) is that coin. Buy D2T now!


Leave a Reply