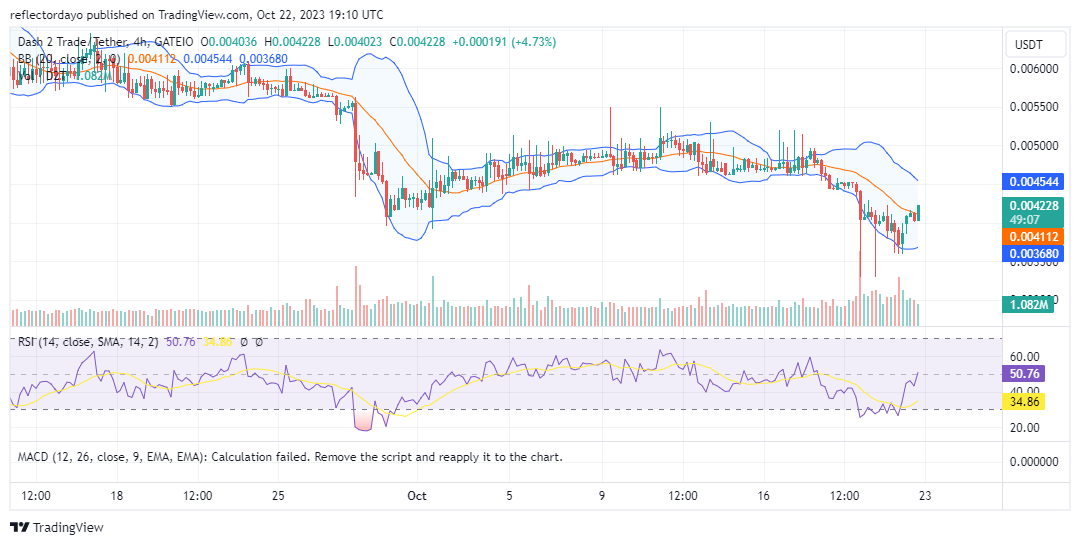
At the outset of the current month, a bullish cycle initiated at the $0.004 price level. The bull market displayed substantial upward momentum during the first half of October, culminating in a peak at the $0.0055 price level. Subsequently, a bearish trend ensued, leading the market to its current position at the $0.0040 price level. Considering the historical performance of this market, the potential for another bullish cycle to emerge from this point remains plausible.
Key Levels
- Resistance: $0.010, $0.011, and $0.012.
- Support: $0.005, $0.004, and $0.003.

Dash 2 Trade (D2TUSD) Price Analysis: The Indicators’ Point of View
The Bollinger Bands indicator is displaying potential indications of an impending Dash 2 Trade price rebound, with the lower band demonstrating a retracement in response to the recent shift in price direction. Notably, the price action has retraced and now hovers above the 20-day moving average, signaling a bullish recovery.
However, the Relative Strength Index (RSI) lags somewhat, with the price action approaching the midpoint of the indicator, denoted by the 50 level. The volume of trade reflects a significant level of volatility, and with the market currently experiencing a bullish recovery, there is a strong likelihood that the bull market may leverage this substantial volatility to propel the market towards its target.

D2T/USD Short-Term Outlook: 1-Hour Chart
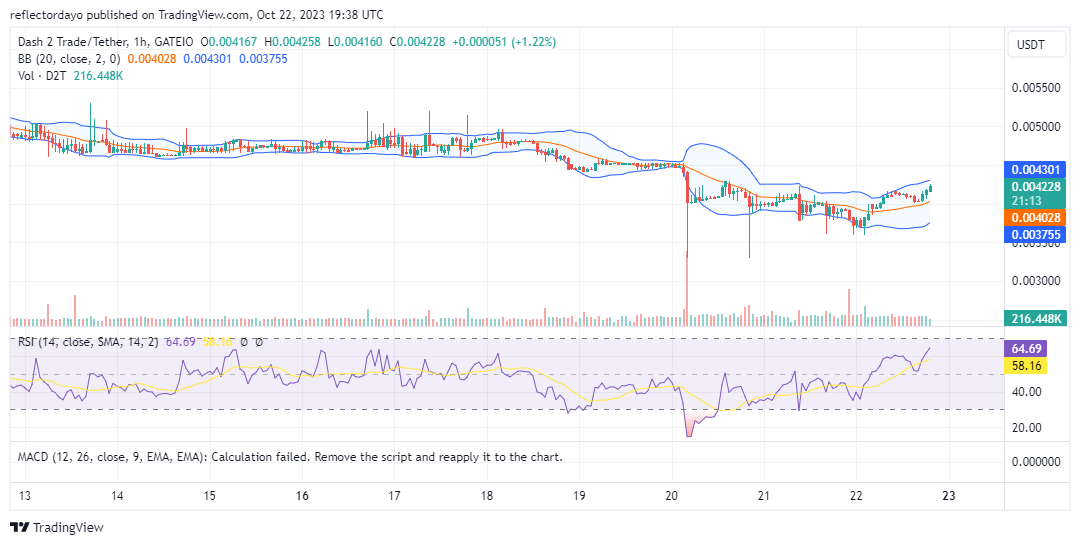
From a 1-hour perspective on the Dash 2 Trade market, there was a notable display of bearish strength at a certain juncture. This compelled the bullish side to regroup beneath the critical support level of $0.004. The bulls subsequently regrouped temporarily around $0.0037, capitalizing effectively on this pivotal juncture. As a result, they successfully elevated the market’s position back above the crucial support level of $0.004. This bullish movement has gained considerable significance, influencing even the upper bands of the Bollinger Bands.
Sellers and buyers are constantly at odds with one another. Candlesticks can reveal a lot about who is now winning and what should be paid attention to.
📊Candlestick strength decoded:
📈Buyers and sellers engage in a constant tug-of-war.
Candlesticks can tell a lot about who’s winning at the moment, and what to pay attention to.💡Have you ever used candlestick strength in your analysis? pic.twitter.com/ldpJMWXRJ9
— Dash 2 Trade (@dash2_trade) October 20, 2023
Do you want a coin with great potential for enormous returns? Dash 2 Trade (D2T) is that coin. Buy D2T now!


Leave a Reply