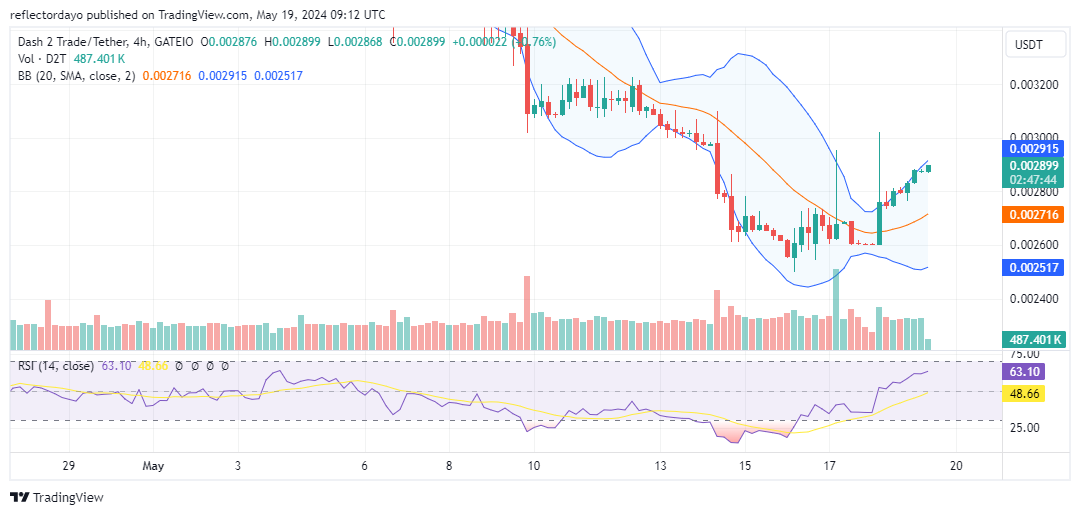
After a mid-May slump that pushed Dash 2 Trade below $0.0035, the bears took aim at the $0.0025 level. But a surge in buying interest halted the decline, establishing support at $0.0025 and triggering a rally back towards $0.003.
This recent weakness may have presented a good buying opportunity. Oversold conditions, possibly due to excessive selling, could be swaying investor sentiment towards a bullish outlook. The current support level seems unlikely to break in the near future.
Key Levels to Watch:
- Resistance: $0.015, $0.016, and $0.017
- Support: $0.0020, $0.0018, and $0.0017

Dash 2 Trade (D2T/USD) Price Analysis: The Indicators’ Point of View
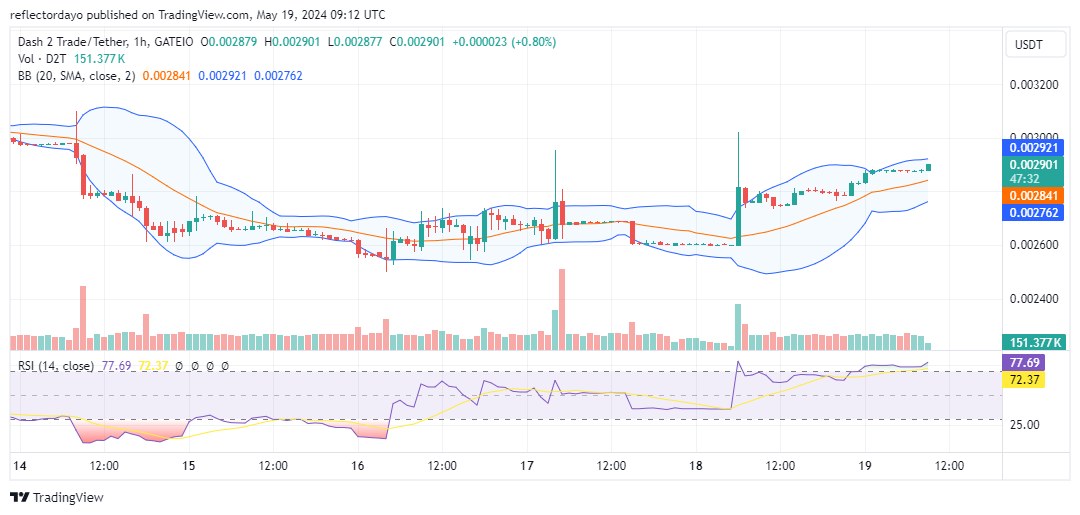
Twice since May 17th, Dash 2 Trade has been rejected at the $0.003 resistance level, indicating seller dominance around this price point. However, the rising support line during the retracement suggests a potential shift in momentum. Bulls are gaining ground as they approach $0.003, putting pressure on the bears. A breakout above this resistance could trigger a surge in bullish sentiment and propel the price towards $0.004.

D2T/USD Short-Term Outlook: 1-Hour Chart
In the latest market analysis, we observed a significant bearish response at $0.003, which caused the Bollinger Bands to widen. However, the Bollinger Bands indicator is now depicting an upward-moving price channel. The two lines of standard deviation and the 20-day moving average are following the price action. This price action hints at the possibility of an imminent breakout due to its flat nature.
These are the top 5 Smart Money purchases:
🚀Smart Money Insights📊
Smart Money is individuals & entities who are seen as experienced & informed, often signaling future trends.
These are the top 5 Smart Money buys past 24-hours:$BEAM$SHIB$ETH$PRIME$AURORA
Visit our Discord for deep dives on Smart Money activity pic.twitter.com/W9EkaXfzaW
— Dash 2 Trade (@dash2_trade) May 17, 2024
Do you want a coin with great potential for enormous returns? Dash 2 Trade (D2T) is that coin. Buy D2T now!


Leave a Reply