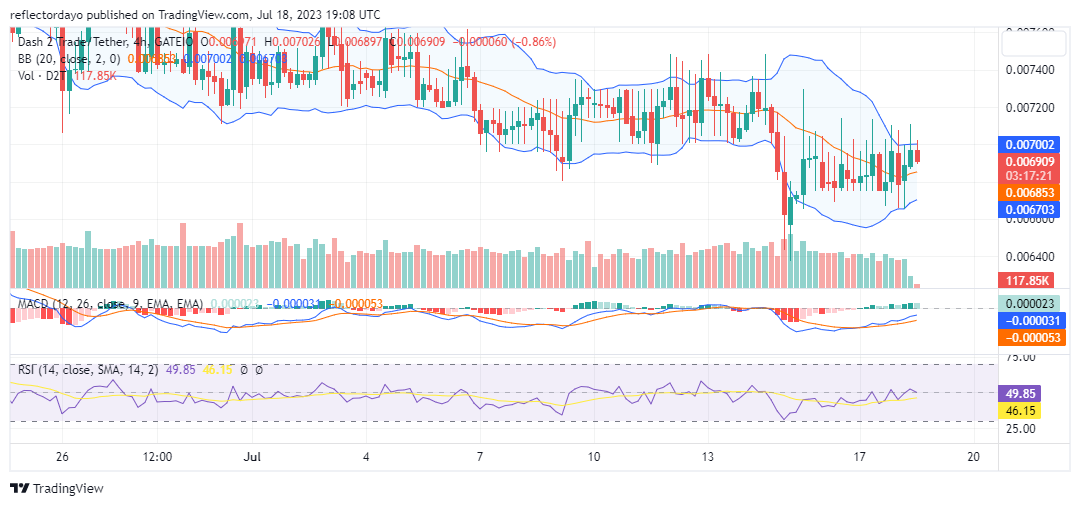
The Dash 2 Trade market has initiated an upward movement, gaining bullish strength from the $0.00672 price level. However, buyers may face difficulties due to heightened market volatility, as a slight resistance could trigger a significant price retracement.
Key Levels
• Resistance: $0.015, $0.016, and $0.017
• Support: $0.006, $0.005 and $0.004.

Dash 2 Trade (D2T/USD) Price Analysis: Indicators’ Perspective
Analytical indicators suggest the beginning of an upward Dash 2 Trade market movement. The Bollinger Bands indicator currently indicates an upward direction for the market.
Despite encountering resistance at the $0.00706 price level and experiencing a strong price retracement, the market continues to move upwards as long as it remains above the 20-day moving average. Additionally, the Relative Strength Index (RSI) shows that the market is slightly above the equilibrium level, giving bulls an advantage.

D2T/USD Short-Term Outlook: 1-Hour Chart
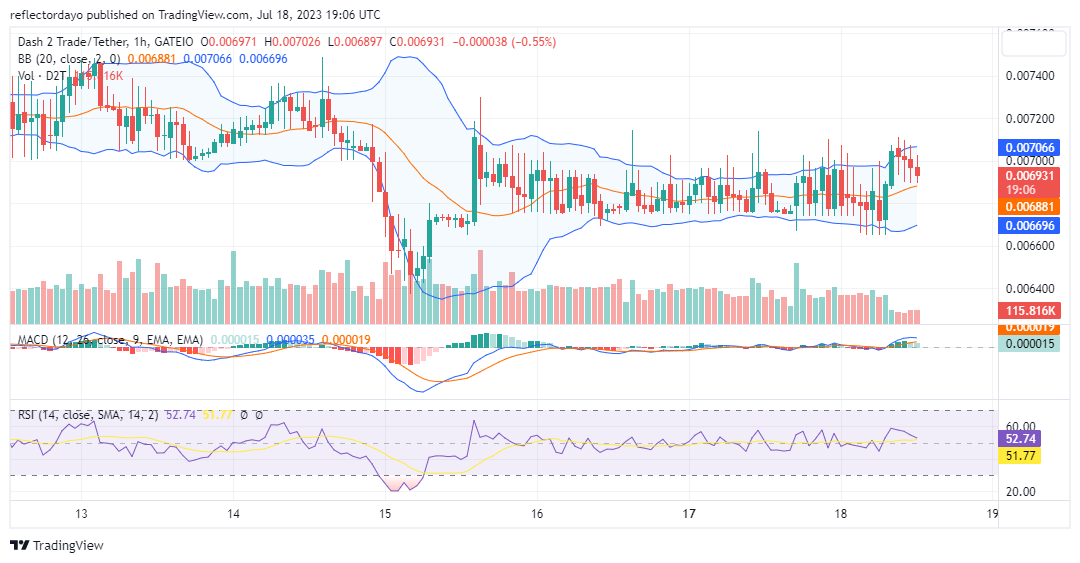
The 1-hour timeframe also supports the notion of an upward market movement. Although the market underwent a strong retracement after reaching the key resistance level, as long as it stays above the 20-day moving average, the overall trajectory of the price channel remains upward.
With Dash 2 Trade, you have the latest trend in the crypto world at your fingertips.
1/9
Just launched on #Binance, @ArkhamIntel ‘s ‘Intel-to-Earn’ stirs both praise & debate. Our Dashboard offers a detailed analysis and we gave it a D2T-Score of 72. Join our Discord for access to it & hundreds of presale analysis.What’s the hype about? Let’s explore!
— Dash 2 Trade (@dash2_trade) July 18, 2023
Do you want a coin with great potential for enormous returns? Dash 2 Trade (D2T) is that coin. Buy D2T now!


Leave a Reply