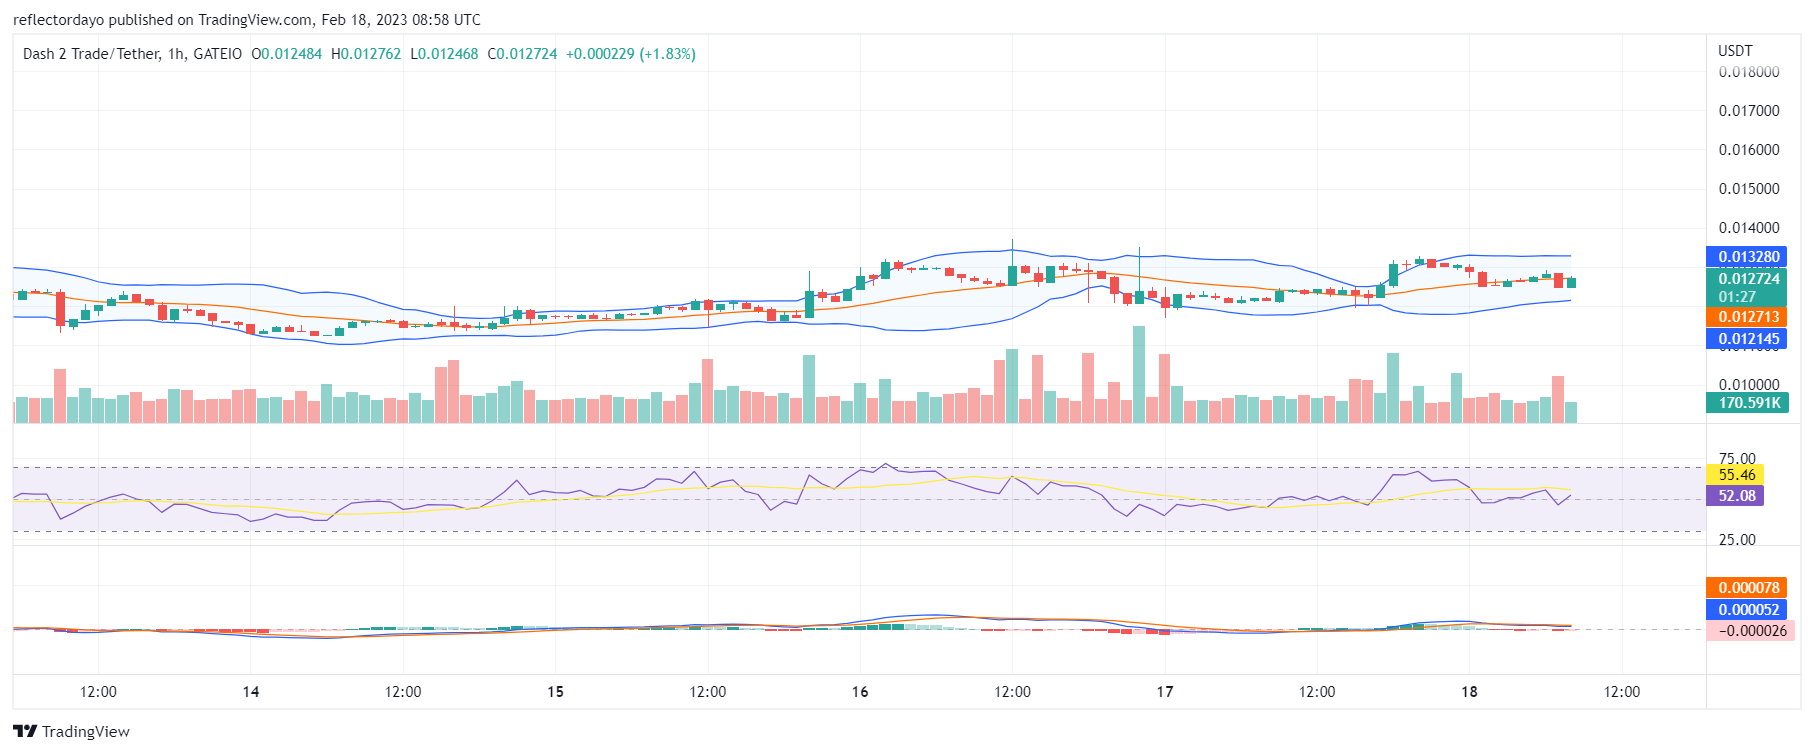
The resistance price level remains at around $0.013. The bears have maintained this price level since February 12. However, since then, we have constantly noticed the candlestick pattern forming higher lows on the chart. This is, in essence, a bullish trend, but with a fixed resistance level. Dash 2 Trade buyers are gradually gaining control over the price, and the key resistance will soon be broken.
Key Levels
- Resistance: $0.019, $0.020, and $0.025
- Support: $0.010, $0.076, $0.005
Dash 2 Trade (D2T) Price Analysis: Bulls Ready to Capture the Resistance Price
Over the time between February 12 and the present, the demand for D2T has been increasing gradually while the selling pressure has remained constant. This implies that a bullish price breakout is imminent. The Bollinger Bands indicator supports this sentiment as it illustrates the price channel now beginning to move upward. The bull market has attempted to break the key resistance level with a strong move on several occasions, but the bullish prices have always been rejected. For each price rejection, the bulls formed higher support levels that brought more pressure to the supply line, as a result of this, the resistance price level prepared to give way to the bulls.

D2T/USD 1-Hour Chart Outlook: The Bulls Are Aggressive
The indicators from the hourly chart also maintain a bullish sentiment. The Bollinger Bands indicator illustrates the price channel moving upward—a sign of strong bullish activities. According to the Relative Strength Index (RSI), the recoiling curve now measures around 52 levels. The bulls set the stage for another battle at the key resistance level.
Dash 2 Trade will help you stay updated on every event in the crypto space. You are going to have access to real-time events, news, and a customizable watchlist on the market. Buy Dash 2 Trade and enjoy all these benefits.
https://twitter.com/dash2_trade/status/1626914514863108097
Want a coin that has a huge potential for massive returns? That coin is Dash 2 Trade. Buy D2T now!


Leave a Reply