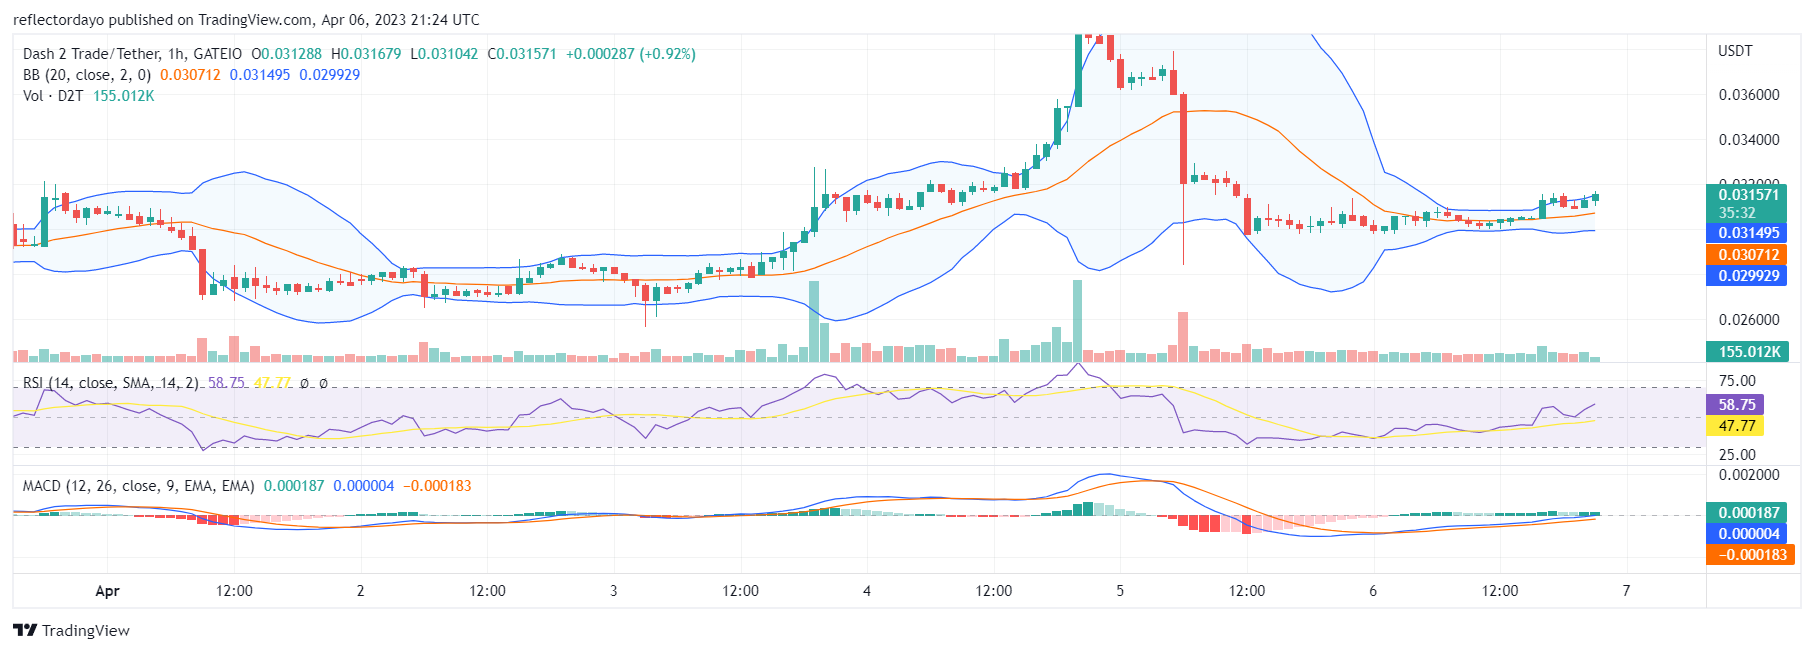
The D2T market had some unpleasant excitement in the past two days when we saw the aggressive rush in the bull market and the bear market. The bull rush was so strong that the price skyrocketed from $0.032 to $0.042, and at this high, a similar bearish run was triggered, and the price fell, but as the market recovered, it found its way back to the equilibrium level. From this new level, the bullish price is on the rise again.
Key Levels
- Resistance: $0.060, $0.065, and $0.070
- Support: $0.020, $0.0025, and $0.030
Dash 2 Trade (D2T) Price Analysis: The Indicators’ Point of View
In the past two days, the volatility of the market reached an epic proportion, and this was reflected in the Bollinger Bands indicator by a big divergence of the two standard deviations. After this harsh excitement, the market came back to its normal price level. Currently, bullish activities are pushing the price to the upside again, but they still have the $0.032 resistance level to capture. From a broad perspective, the D2T market is in an uptrend. From March 25 until now, the market has continued to have higher lows. Again, the bulls are setting new targets; they want to claim $0.032 as the new support level.

D2T/USD Short-Term Outlook: (1-Hour Chart)
After the seemingly extreme price swing, the market settled back into gridlock. But now, we can see that the bull market is breaking away from the deadlock. The Bollinger Bands indicator is illustrating this move as the bands show the price channel moving in an upward direction. The Relative Strength Index shows how the bull market is gaining momentum as the RSI line rises from level 50 to level 59.
Be part of the Dash 2 Trade community and benefit from the latest trends and useful ideas on the platform.
https://twitter.com/dash2_trade/status/1643992010922262528
Do you want a coin with great potential for enormous returns? Dash 2 Trade (D2T) is that coin. Buy D2T now!


Leave a Reply