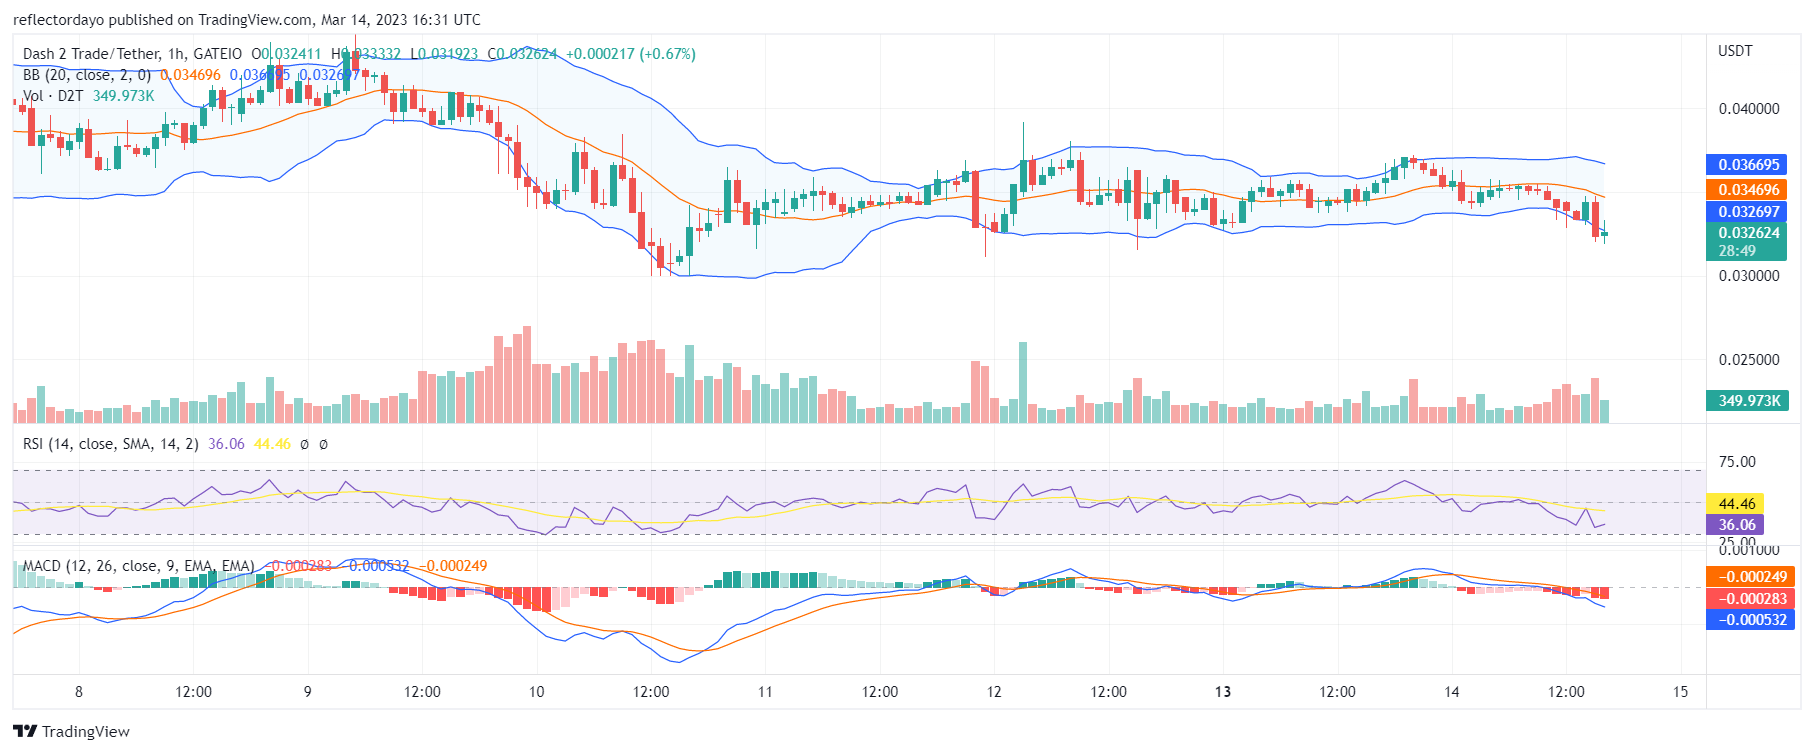
The D2T market has been moving sideways along the $0.035 price level since March 11, even though the price has oscillated between the bulls and the bears. Both the buyers and sellers have hung on to this price level for quite a while; the bull market is expected to break this deadlock and set the market sailing in an upward direction.
Key Levels
- Resistance: $0.060, $0.065, and $0.070
- Support: $0.020, $0.0025, and $0.030
Dash 2 Trade (D2T) Price Analysis: The Indicators’ Point of View
Looking at the market from the perspective of the Bollinger Bands indicator, the narrowness of the price channel is increasing. This is well illustrated by the Bollinger Bands, as the two standard deviation curves move very closely along with the price activities. Usually, at the peak of the bands’ convergence, we should see the market moving decisively to the upside.

Dash 2 Trade Short-Term Outlook: (1-Hour Chart)
According to the Bollinger Bands indicator perspective of the market from this timeframe, the bear market has gone into oversold territory. The price action is now performing outside the lower band. That means that the price will rally as the market corrects itself back into the bands. As the bull market bounces back, the first price level to capture is $0.035. Capturing this level will turn the market in an upward direction.
On the Dash 2 Trade platform, you will access to trading tools, on-chain research, and effective trade alerts.
🚀 Our #D2T platform is here to take your #cryptotrading to the next level! 💰
📈 Get access to actionable #trading signals, on-chain analysis, and advanced trading tools. 🔍
👉 Visit our website to learn more: https://t.co/ExvBBjKIU6 pic.twitter.com/uZrHyVseCh
— Dash 2 Trade (@dash2_trade) March 14, 2023
Do you want a coin with great potential for enormous returns? Dash 2 Trade (D2T) is that coin. Buy D2T now!


Leave a Reply