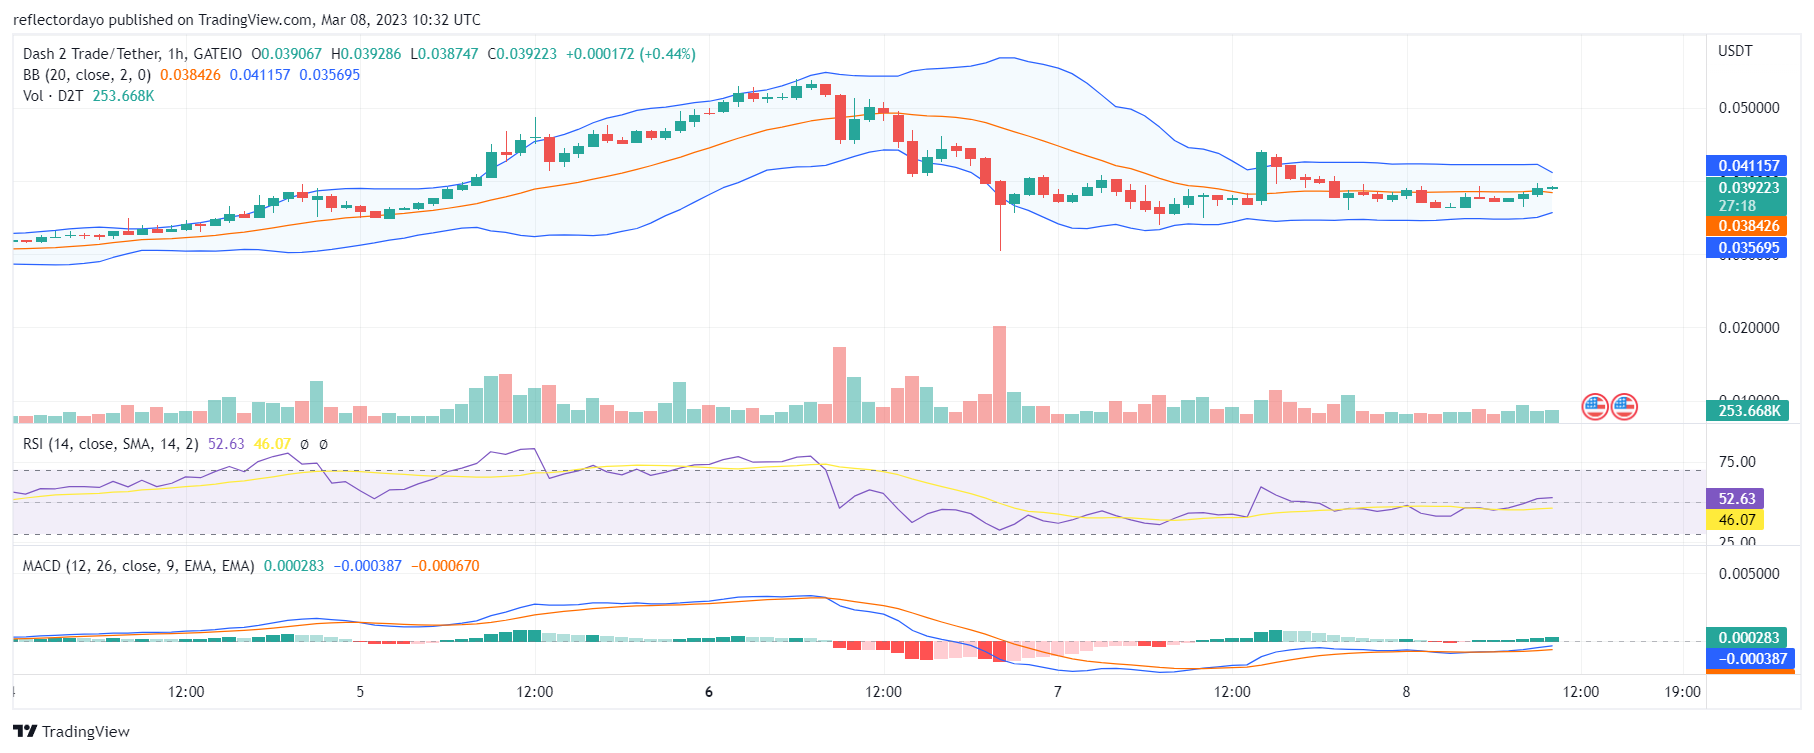
The $0.035 price level has become a strong brick wall for the D2T bear market. However, the bulls are not yet strong enough to take the market out of the $0.035 and $0.040 price levels. A very aggressive move in the previous session that took the market above $0.040 could not be sustained as the bull market faced exhaustion. This was followed by a bearish move of equal magnitude in the following four-hour session. The two market forces were responsive to each other until the 8 a.m. session began. The bulls are now coming back into the market.
Key Levels
- Resistance: $0.060, $0.065, and $0.070
- Support: $0.020, $0.0025, and $0.030
Dash 2 Trade (D2T) Price Analysis: The Indicators’ Point of View—Demand and Supply Match Forces
The price retracement was an opportunity for more bulls to join the market. However, because some of these traders are going short after reaching their targets, this slows down the progress as the market approaches the $0.040 price level. In the Relative Strength Index (RSI), the momentum of the market is measured in the space between demand and supply. According to the Moving Average Convergence and Divergence (MACD), the bullish sentiment is still maintained as the two lines are still above level zero, and the negative histograms now reflect an increase in buying pressure.

D2T/USD Short-Term Outlook: (1-Hour Chart)
On a smaller timeframe, the price consolidation trend comes out more clearly, and the Bollinger Bands indicator properly illustrated this. As the price action reached the 20-day moving average, the two bands appeared to be convergent. That can be a sign of an imminent decisive price breakout, which will be to the upside as the general market’s bullish sentiment is still being conserved.
The Dash 2 Trade presale area is live and available for testing in its beta edition.
https://twitter.com/dash2_trade/status/1633467694921175041
Want a coin that has a huge potential for massive returns? That coin is Dash 2 Trade. Buy D2T now!


Leave a Reply