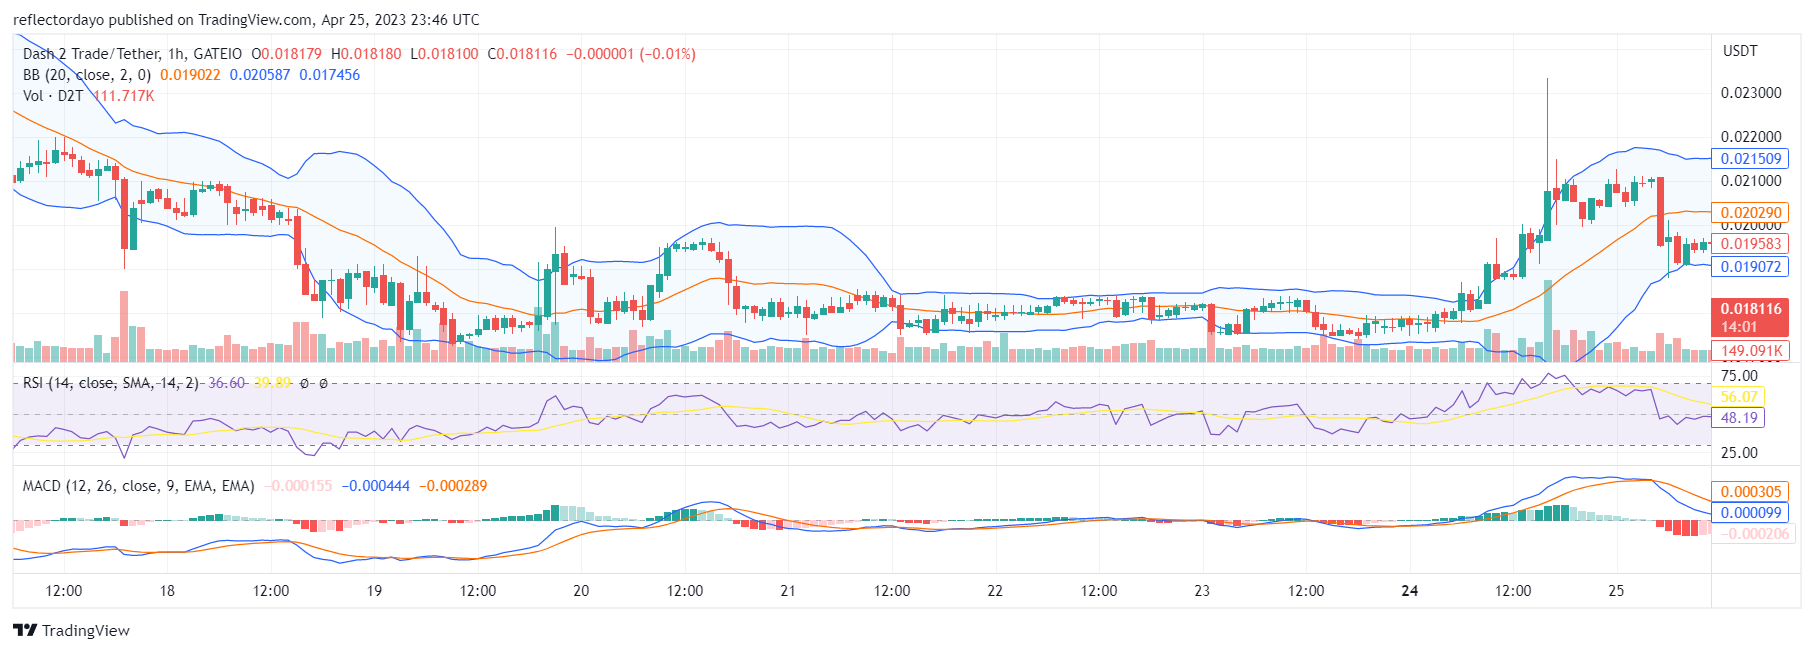
After hitting the high of $0.0227 in the previous session, a significant bearish move was triggered, resulting in a price retracement that put the market at the edge of the demand zone. The Dash 2 Trade bulls were so quick to salvage the market at the $0.019 price level. From this level, the bullish trend resumes.
Key Levels
- Resistance: $0.060, $0.065, and $0.070
- Support: $0.017, $0.016, and $0.015
Dash 2 Trade (D2T) Price Analysis: The Indicators’ Point of View
The $0.019 price level is a higher support level, which should give the bulls the edge of bouncing back for more bullish action. The Moving Average Convergence and Divergence (MACD) illustrates this quick recovery with its positive histograms and lines. Although, the faded green histograms are a pointer to the bearish activities that are issued from the key resistance level. These bearish activities have reduced the buying momentum, but the buying is also recovering. According to the Relative Strength Index, the RSI line is portraying the recovery of the market.

D2T/USD Short-Term Outlook: (1-Hour Chart)
For now, the low volume of trade may be the reason for the slow bullish recovery. This experience in the market right now may not last and as soon as activities begin to increase, the bull market may continue toward it targeted price. The hyper-bullish move in the previous daily session may have caused exhaustion in the bull market, but the bulls are quickly recovering.
Create custom automated trading plans based on important data and order types.
Set up your own automated #Trading strategies based on key metrics and order types.
With our innovative system, you can easily link D2T's metrics with your #Trading strategies, for smarter and more profitable #Trades. 🚀
Buy $D2T now!⬇️https://t.co/J5q9iuWuAu pic.twitter.com/WLGFIV9XUF
— Dash 2 Trade (@dash2_trade) April 25, 2023
Do you want a coin with great potential for enormous returns? Dash 2 Trade (D2T) is that coin. Buy D2T now!


Leave a Reply